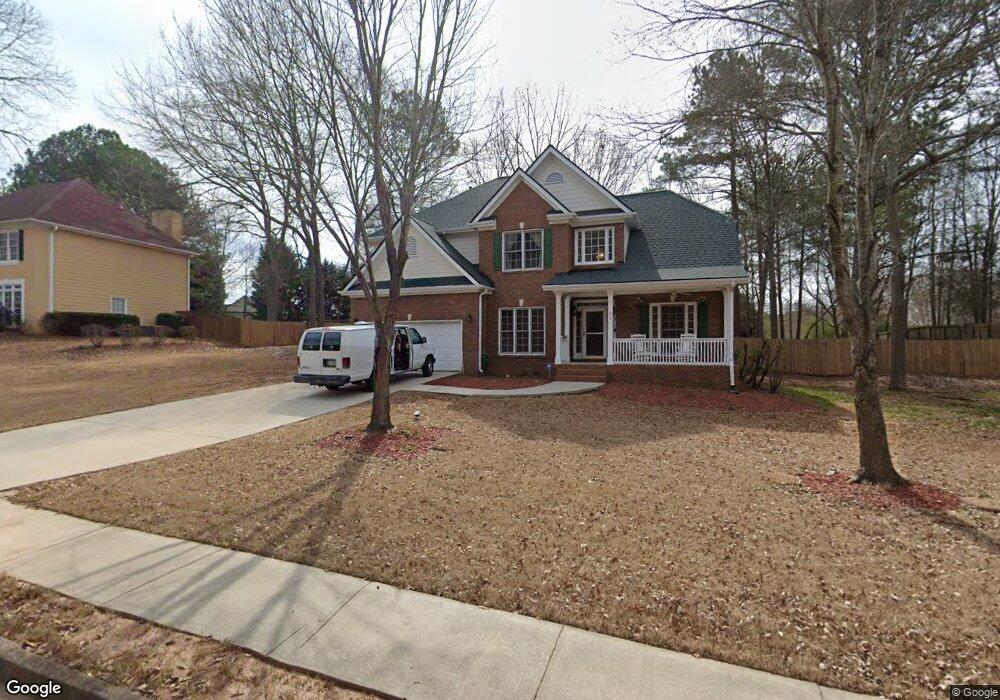
3 Pecan Crescent Newnan, GA 30265
Summergrove NeighborhoodEstimated Value: $402,647 - $457,000
3
Beds
4
Baths
2,760
Sq Ft
$160/Sq Ft
Est. Value
About This Home
This home is located at 3 Pecan Crescent, Newnan, GA 30265 and is currently estimated at $440,662, approximately $159 per square foot. 3 Pecan Crescent is a home located in Coweta County with nearby schools including Welch Elementary School, Lee Middle School, and East Coweta High School.
Ownership History
Date
Name
Owned For
Owner Type
Purchase Details
Closed on
Jul 15, 2003
Sold by
Crowley Kelly
Bought by
National Residential Nominee Svc
Current Estimated Value
Home Financials for this Owner
Home Financials are based on the most recent Mortgage that was taken out on this home.
Original Mortgage
$231,336
Outstanding Balance
$97,908
Interest Rate
5.2%
Mortgage Type
VA
Estimated Equity
$342,754
Purchase Details
Closed on
Mar 20, 2001
Sold by
Morrison Homes Inc
Bought by
Crowley Kelly
Home Financials for this Owner
Home Financials are based on the most recent Mortgage that was taken out on this home.
Original Mortgage
$198,000
Interest Rate
6.99%
Mortgage Type
New Conventional
Purchase Details
Closed on
Sep 29, 1998
Bought by
Morrison Homes Of Fl
Purchase Details
Closed on
Jun 12, 1997
Bought by
Peachtree City Holdi
Purchase Details
Closed on
Jun 30, 1984
Bought by
Jefferson Ventures I
Create a Home Valuation Report for This Property
The Home Valuation Report is an in-depth analysis detailing your home's value as well as a comparison with similar homes in the area
Home Values in the Area
Average Home Value in this Area
Purchase History
| Date | Buyer | Sale Price | Title Company |
|---|---|---|---|
| National Residential Nominee Svc | $225,000 | -- | |
| Allen Regina L | $226,800 | -- | |
| Crowley Kelly | $220,000 | -- | |
| Morrison Homes Of Fl | $28,700 | -- | |
| Peachtree City Holdi | $2,828,900 | -- | |
| Jefferson Ventures I | -- | -- |
Source: Public Records
Mortgage History
| Date | Status | Borrower | Loan Amount |
|---|---|---|---|
| Open | Allen Regina L | $231,336 | |
| Previous Owner | Crowley Kelly | $198,000 |
Source: Public Records
Tax History Compared to Growth
Tax History
| Year | Tax Paid | Tax Assessment Tax Assessment Total Assessment is a certain percentage of the fair market value that is determined by local assessors to be the total taxable value of land and additions on the property. | Land | Improvement |
|---|---|---|---|---|
| 2024 | $763 | $150,414 | $28,000 | $122,414 |
| 2023 | $763 | $134,486 | $24,000 | $110,486 |
| 2022 | $682 | $129,784 | $24,000 | $105,784 |
| 2021 | $178 | $107,536 | $20,000 | $87,536 |
| 2020 | $472 | $107,536 | $20,000 | $87,536 |
| 2019 | $553 | $104,043 | $18,000 | $86,043 |
| 2018 | $694 | $104,043 | $18,000 | $86,043 |
| 2017 | $764 | $102,688 | $18,000 | $84,688 |
| 2016 | $463 | $89,138 | $18,000 | $71,138 |
| 2015 | $563 | $89,138 | $18,000 | $71,138 |
| 2014 | $525 | $78,975 | $18,000 | $60,975 |
Source: Public Records
Map
Nearby Homes
- Landon Plan at Daybreak
- Lana Plan at Daybreak
- Grable Plan at Daybreak
- 16 Daybreak Ln
- 103 Daybreak Ln
- 113 Daybreak Ln
- 1903 Daybreak Ln
- 206 Daybreak Ln
- 204 Daybreak Ln
- 212 Daybreak Ln
- 111 Daybreak Ln
- 202 Daybreak Ln
- 274 Daybreak Ln
- 43 Ulsh Park Dr
- 50 Foxcroft Ct
- 163 Macalester Dr
- 219 Highwoods Pkwy
- 2 Crimson Way
- 11 Rockridge Dr
- 11 Pecan Crescent Unit A
- 2 Briarleigh Way
- 19 Pecan Crescent
- 0 Briarleigh Way Unit 8891524
- 0 Briarleigh Way Unit 8256699
- 0 Briarleigh Way
- 42 Verandah Place
- 37 Verandah Place
- 27 Pecan Crescent
- 27 Pecan Crescent Unit 15
- 8 Briarleigh Way
- 38 Verandah Place
- 4 Saddlewood
- 33 Verandah Place
- 5 Briarleigh Way
- 33 Pecan Crescent
- 12 Saddlewood
- 18 Saddlewood
- 36 Verandah Place
- 14 Briarleigh Way