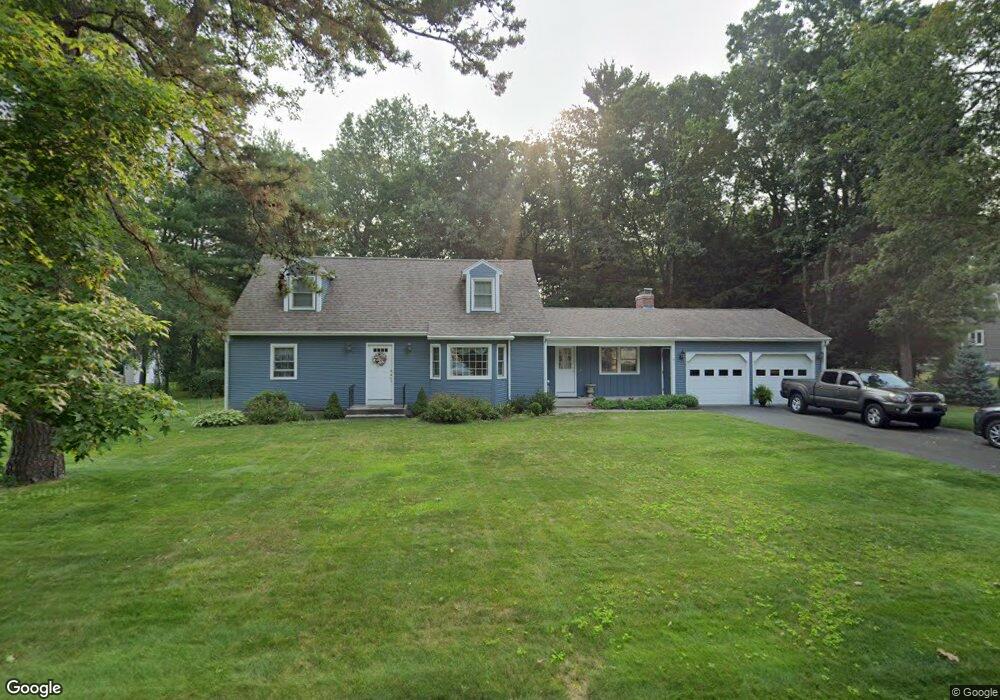
3 Pheasant Farm Rd Wilbraham, MA 01095
Estimated Value: $497,000 - $567,000
4
Beds
2
Baths
2,109
Sq Ft
$247/Sq Ft
Est. Value
About This Home
This home is located at 3 Pheasant Farm Rd, Wilbraham, MA 01095 and is currently estimated at $520,644, approximately $246 per square foot. 3 Pheasant Farm Rd is a home located in Hampden County with nearby schools including Minnechaug Regional High School and Wilbraham & Monson Academy.
Ownership History
Date
Name
Owned For
Owner Type
Purchase Details
Closed on
Sep 1, 1999
Sold by
Douma Oscar and Douma Karen
Bought by
Germani Michael S and Germani Barbara M
Current Estimated Value
Home Financials for this Owner
Home Financials are based on the most recent Mortgage that was taken out on this home.
Original Mortgage
$153,000
Interest Rate
7.5%
Mortgage Type
Purchase Money Mortgage
Purchase Details
Closed on
Jun 1, 1989
Sold by
Dimitriou George D
Bought by
Douma Oscar
Create a Home Valuation Report for This Property
The Home Valuation Report is an in-depth analysis detailing your home's value as well as a comparison with similar homes in the area
Home Values in the Area
Average Home Value in this Area
Purchase History
| Date | Buyer | Sale Price | Title Company |
|---|---|---|---|
| Germani Michael S | $230,000 | -- | |
| Douma Oscar | $217,000 | -- |
Source: Public Records
Mortgage History
| Date | Status | Borrower | Loan Amount |
|---|---|---|---|
| Open | Douma Oscar | $20,000 | |
| Open | Douma Oscar | $153,000 | |
| Closed | Douma Oscar | $153,000 |
Source: Public Records
Tax History
| Year | Tax Paid | Tax Assessment Tax Assessment Total Assessment is a certain percentage of the fair market value that is determined by local assessors to be the total taxable value of land and additions on the property. | Land | Improvement |
|---|---|---|---|---|
| 2025 | $7,994 | $447,100 | $110,800 | $336,300 |
| 2024 | $7,246 | $391,700 | $110,800 | $280,900 |
| 2023 | $7,192 | $363,900 | $110,800 | $253,100 |
| 2022 | $7,192 | $351,000 | $110,800 | $240,200 |
| 2021 | $6,833 | $297,600 | $116,700 | $180,900 |
| 2020 | $6,660 | $297,600 | $116,700 | $180,900 |
| 2019 | $6,488 | $297,600 | $116,700 | $180,900 |
| 2018 | $6,267 | $276,800 | $116,700 | $160,100 |
| 2017 | $5,856 | $266,200 | $116,700 | $149,500 |
| 2016 | $5,864 | $271,500 | $129,600 | $141,900 |
| 2015 | $5,669 | $271,500 | $129,600 | $141,900 |
Source: Public Records
Map
Nearby Homes
Your Personal Tour Guide
Ask me questions while you tour the home.