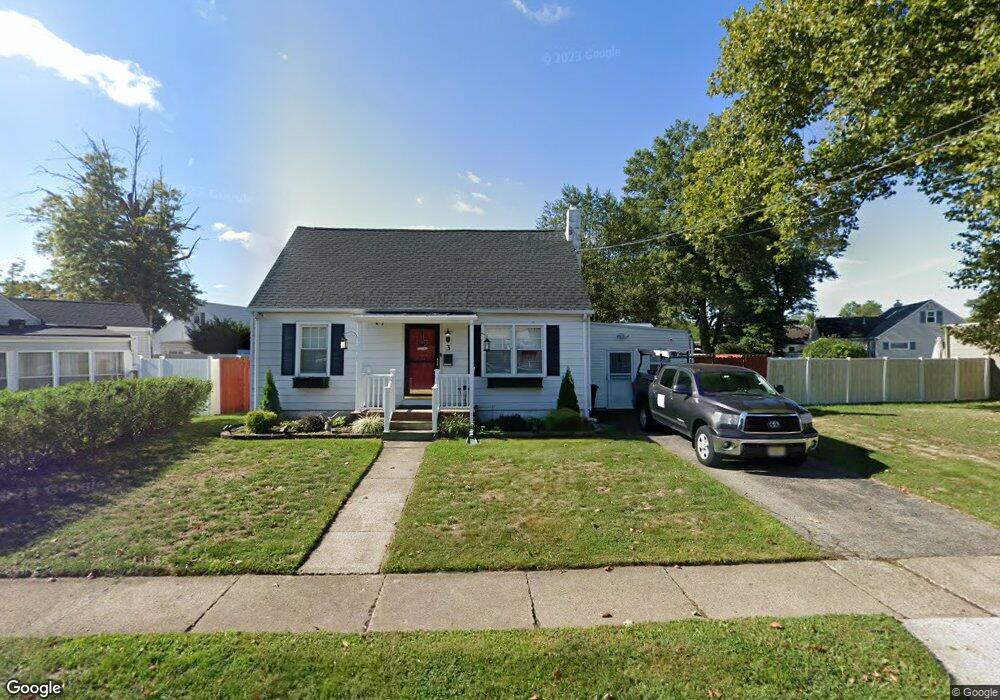
3 Pheasant Ln Trenton, NJ 08690
Estimated Value: $432,000 - $522,000
3
Beds
2
Baths
1,165
Sq Ft
$395/Sq Ft
Est. Value
About This Home
This home is located at 3 Pheasant Ln, Trenton, NJ 08690 and is currently estimated at $460,737, approximately $395 per square foot. 3 Pheasant Ln is a home located in Mercer County with nearby schools including Sayen Elementary School, Emily C. Reynolds Middle School, and Steinert - Hamilton High East.
Ownership History
Date
Name
Owned For
Owner Type
Purchase Details
Closed on
Jul 17, 2008
Sold by
Daniels Ann
Bought by
Zgrajewicz Marcin and Zgrajewicz Emilie
Current Estimated Value
Home Financials for this Owner
Home Financials are based on the most recent Mortgage that was taken out on this home.
Original Mortgage
$261,900
Interest Rate
6.4%
Mortgage Type
New Conventional
Create a Home Valuation Report for This Property
The Home Valuation Report is an in-depth analysis detailing your home's value as well as a comparison with similar homes in the area
Home Values in the Area
Average Home Value in this Area
Purchase History
| Date | Buyer | Sale Price | Title Company |
|---|---|---|---|
| Zgrajewicz Marcin | $265,000 | Fidelity Natl Title Ins Co | |
| Zgrajewicz Marcin | $265,000 | -- |
Source: Public Records
Mortgage History
| Date | Status | Borrower | Loan Amount |
|---|---|---|---|
| Previous Owner | Zgrajewicz Marcin | $261,900 | |
| Previous Owner | Zgrajewicz Marcin | $254,130 |
Source: Public Records
Tax History Compared to Growth
Tax History
| Year | Tax Paid | Tax Assessment Tax Assessment Total Assessment is a certain percentage of the fair market value that is determined by local assessors to be the total taxable value of land and additions on the property. | Land | Improvement |
|---|---|---|---|---|
| 2025 | $7,295 | $207,000 | $82,500 | $124,500 |
| 2024 | $6,837 | $207,000 | $82,500 | $124,500 |
| 2023 | $6,837 | $207,000 | $82,500 | $124,500 |
| 2022 | $6,730 | $207,000 | $82,500 | $124,500 |
| 2021 | $7,086 | $207,000 | $82,500 | $124,500 |
| 2020 | $6,340 | $207,000 | $82,500 | $124,500 |
| 2019 | $6,200 | $207,000 | $82,500 | $124,500 |
| 2018 | $6,164 | $207,000 | $82,500 | $124,500 |
| 2017 | $6,007 | $207,000 | $82,500 | $124,500 |
| 2016 | $5,597 | $207,000 | $82,500 | $124,500 |
| 2015 | $6,415 | $139,800 | $54,200 | $85,600 |
| 2014 | $6,306 | $139,800 | $54,200 | $85,600 |
Source: Public Records
Map
Nearby Homes