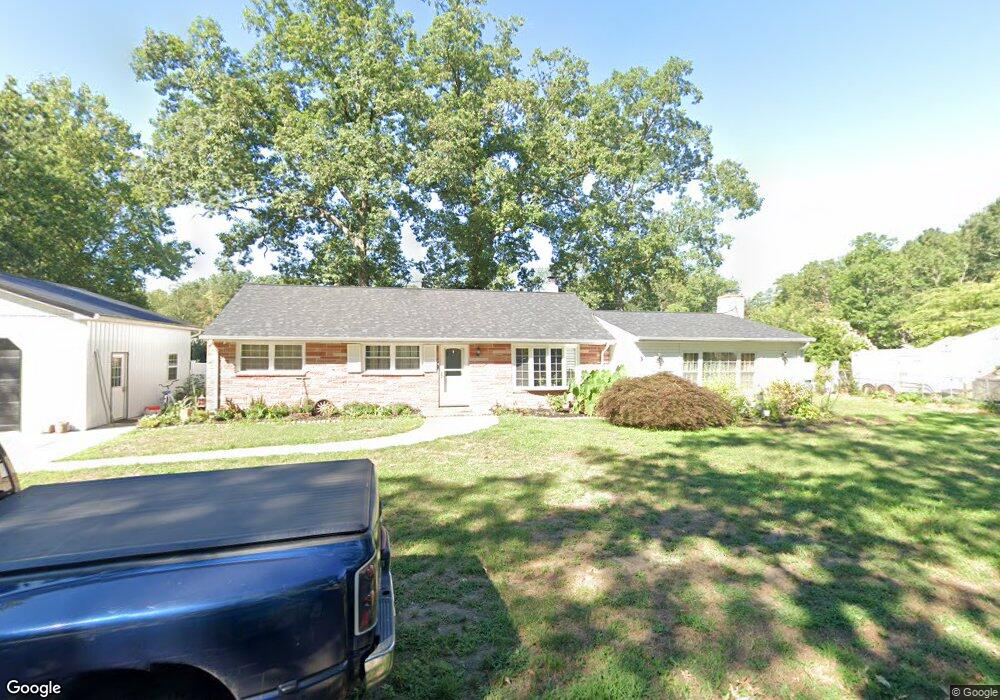
3 Pine Ave Browns Mills, NJ 08015
Estimated Value: $287,000 - $363,000
--
Bed
--
Bath
1,592
Sq Ft
$211/Sq Ft
Est. Value
About This Home
This home is located at 3 Pine Ave, Browns Mills, NJ 08015 and is currently estimated at $336,654, approximately $211 per square foot. 3 Pine Ave is a home located in Burlington County.
Ownership History
Date
Name
Owned For
Owner Type
Purchase Details
Closed on
Jan 27, 2012
Sold by
Dawson Joseph C and Dawson Tiffany A
Bought by
Dawson Joseph C and Dawson Tiffany A
Current Estimated Value
Home Financials for this Owner
Home Financials are based on the most recent Mortgage that was taken out on this home.
Original Mortgage
$176,649
Outstanding Balance
$119,765
Interest Rate
3.75%
Mortgage Type
FHA
Estimated Equity
$216,889
Purchase Details
Closed on
Mar 11, 2005
Sold by
Lopez Anthony and Santiago Ramonita
Bought by
Dawson Joseph C
Home Financials for this Owner
Home Financials are based on the most recent Mortgage that was taken out on this home.
Original Mortgage
$156,289
Interest Rate
5.64%
Mortgage Type
VA
Purchase Details
Closed on
Jan 30, 2002
Sold by
Pena Apolinar and Pena Sharon
Bought by
Lopez Anthony and Santiago Ramonita
Home Financials for this Owner
Home Financials are based on the most recent Mortgage that was taken out on this home.
Original Mortgage
$104,176
Interest Rate
7.08%
Purchase Details
Closed on
Dec 2, 1999
Sold by
Osorio Norberto and Osorio Sherri
Bought by
Pena Apolinar and Pena Sharon
Create a Home Valuation Report for This Property
The Home Valuation Report is an in-depth analysis detailing your home's value as well as a comparison with similar homes in the area
Home Values in the Area
Average Home Value in this Area
Purchase History
| Date | Buyer | Sale Price | Title Company |
|---|---|---|---|
| Dawson Joseph C | -- | Transtar National Title | |
| Dawson Joseph C | $153,000 | -- | |
| Lopez Anthony | $105,000 | Congress Title Corp | |
| Pena Apolinar | $72,500 | Congress Title Corp |
Source: Public Records
Mortgage History
| Date | Status | Borrower | Loan Amount |
|---|---|---|---|
| Open | Dawson Joseph C | $176,649 | |
| Closed | Dawson Joseph C | $156,289 | |
| Previous Owner | Lopez Anthony | $104,176 |
Source: Public Records
Tax History Compared to Growth
Tax History
| Year | Tax Paid | Tax Assessment Tax Assessment Total Assessment is a certain percentage of the fair market value that is determined by local assessors to be the total taxable value of land and additions on the property. | Land | Improvement |
|---|---|---|---|---|
| 2025 | $5,572 | $181,800 | $41,500 | $140,300 |
| 2024 | $5,229 | $181,800 | $41,500 | $140,300 |
| 2023 | $5,229 | $181,800 | $41,500 | $140,300 |
| 2022 | $4,840 | $181,800 | $41,500 | $140,300 |
| 2021 | $4,641 | $181,800 | $41,500 | $140,300 |
| 2020 | $4,467 | $181,800 | $41,500 | $140,300 |
| 2019 | $4,278 | $181,800 | $41,500 | $140,300 |
| 2018 | $4,132 | $181,800 | $41,500 | $140,300 |
| 2017 | $3,851 | $173,000 | $41,500 | $131,500 |
| 2016 | $4,089 | $109,400 | $28,900 | $80,500 |
| 2015 | $4,057 | $109,400 | $28,900 | $80,500 |
| 2014 | $3,878 | $109,400 | $28,900 | $80,500 |
Source: Public Records
Map
Nearby Homes
- 5 Chestnut Ave
- 136 S Lakeshore Dr
- 30 Press Ave
- 55 Columbus Ave
- 12 Miller St
- 120 Clubhouse Rd
- 355 Wildrose St
- 156 Morris St
- 108 Juliustown Rd
- 143 Plum St
- 135 Trenton Rd
- 301 W Lakeshore Dr
- 30 Earlin Ave
- 330 Woodbine St
- 402 W Lakeshore Dr
- 311 Sumach St
- 34 Olive St
- 102 Sunset St
- 304 Otter Ave
- 25 Railroad St