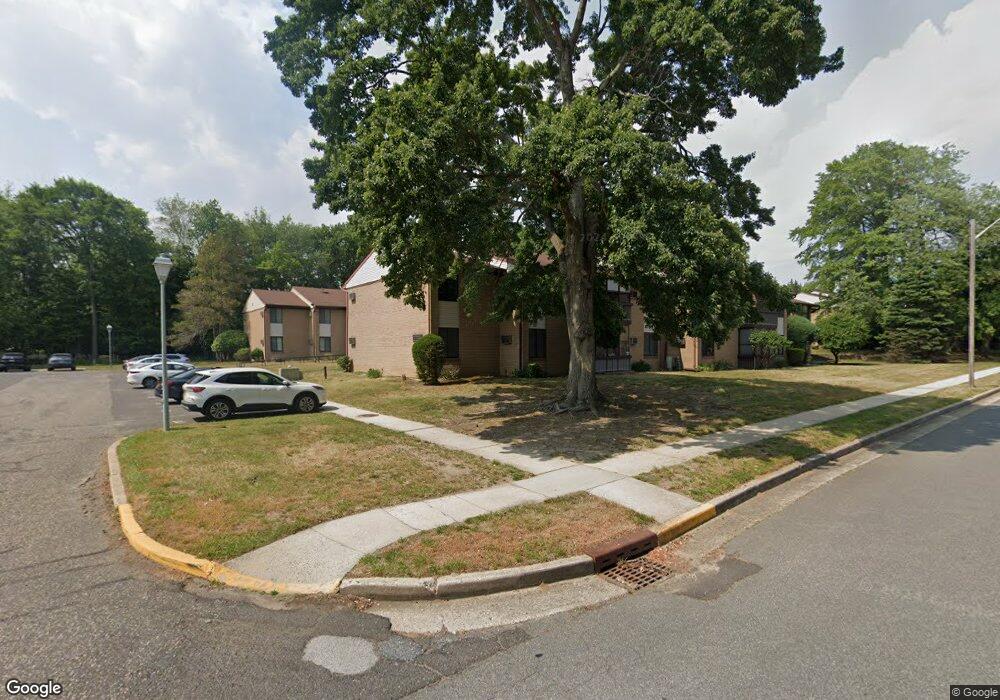
3 Pine Cluster Cir Unit D Manalapan, NJ 07726
Estimated Value: $209,000 - $239,000
1
Bed
1
Bath
920
Sq Ft
$241/Sq Ft
Est. Value
About This Home
This home is located at 3 Pine Cluster Cir Unit D, Manalapan, NJ 07726 and is currently estimated at $221,368, approximately $240 per square foot. 3 Pine Cluster Cir Unit D is a home located in Monmouth County with nearby schools including Milford Brook Elementary School, Pine Brook Elementary School, and Manalapan-Englishtown Middle School.
Ownership History
Date
Name
Owned For
Owner Type
Purchase Details
Closed on
Nov 24, 2020
Sold by
Covered Bridge Condominum Association In
Bought by
Given Not
Current Estimated Value
Purchase Details
Closed on
Jan 6, 2020
Sold by
Pahira Robert and Pahira Michael S
Bought by
Maya Albert and Maya Jane
Purchase Details
Closed on
Sep 9, 2008
Sold by
Estate Of Henrietta Hirsch
Bought by
Pahira Michael and Pahira Robert
Home Financials for this Owner
Home Financials are based on the most recent Mortgage that was taken out on this home.
Original Mortgage
$72,000
Interest Rate
6.58%
Mortgage Type
Purchase Money Mortgage
Purchase Details
Closed on
May 18, 1995
Sold by
Cordasco Rose
Bought by
Hirsch Henrietta
Create a Home Valuation Report for This Property
The Home Valuation Report is an in-depth analysis detailing your home's value as well as a comparison with similar homes in the area
Home Values in the Area
Average Home Value in this Area
Purchase History
| Date | Buyer | Sale Price | Title Company |
|---|---|---|---|
| Given Not | -- | Kwasnik John F | |
| Maya Albert | $127,000 | All Ahead Title Agency | |
| Pahira Michael | $90,000 | None Available | |
| Hirsch Henrietta | $57,000 | -- |
Source: Public Records
Mortgage History
| Date | Status | Borrower | Loan Amount |
|---|---|---|---|
| Previous Owner | Pahira Michael | $72,000 |
Source: Public Records
Tax History Compared to Growth
Tax History
| Year | Tax Paid | Tax Assessment Tax Assessment Total Assessment is a certain percentage of the fair market value that is determined by local assessors to be the total taxable value of land and additions on the property. | Land | Improvement |
|---|---|---|---|---|
| 2025 | $3,043 | $205,600 | $90,000 | $115,600 |
| 2024 | $2,842 | $180,300 | $80,000 | $100,300 |
| 2023 | $2,842 | $170,800 | $70,000 | $100,800 |
| 2022 | $2,583 | $155,000 | $59,000 | $96,000 |
| 2021 | $2,583 | $124,400 | $39,000 | $85,400 |
| 2020 | $2,441 | $118,900 | $34,000 | $84,900 |
| 2019 | $2,213 | $107,700 | $20,500 | $87,200 |
| 2018 | $2,141 | $103,600 | $20,500 | $83,100 |
| 2017 | $2,099 | $101,600 | $22,000 | $79,600 |
| 2016 | $1,999 | $97,900 | $19,400 | $78,500 |
| 2015 | $1,754 | $85,000 | $8,500 | $76,500 |
| 2014 | $1,643 | $77,500 | $18,000 | $59,500 |
Source: Public Records
Map
Nearby Homes
- 521 Union Hill Rd
- 519 Union Hill Rd
- 54 Amberly Dr Unit G
- 5 Yeoman Way
- 13 Hawkins Rd
- 321 Sunshine Ct
- 544 Union Hill Rd
- 29 Meadow Green Cir Unit A
- 418 Union Hill Rd
- 11 Rowena Rd
- 30 Meadow Green Cir Unit E
- 306 Sunshine Ct
- 167 Amberly Dr Unit H
- 278 Sunshine Ct
- 133 Sunnymede St
- 123 Sunnymede St
- 15 Eastwood Blvd
- 86 Arrowood Rd Unit B
- 84 Amberly Dr Unit J
- 75 Overlook Way Unit K
- 3 Pine Cluster Cir Unit G
- 3 Pine Cluster Cir Unit E
- 3 Pine Cluster Cir Unit H
- 3 Pine Cluster Cir Unit J
- 3 Pine Cluster Cir Unit B
- 3 Pine Cluster Cir Unit F
- 3 Pine Cluster Cir Unit K
- 3 Pine Cluster Cir Unit C
- 3 Pine Cluster Cir Unit A
- 3 Pine Cluster Cir
- 2 Wild Turkey Way Unit E
- 2 Wild Turkey Way Unit D
- 2 Wild Turkey Way Unit C
- 2 Wild Turkey Way Unit H
- 2 Wild Turkey Way Unit B
- 2 Wild Turkey Way Unit K
- 2 Wild Turkey Way Unit F
- 2 Wild Turkey Way Unit J
- 2 Wild Turkey Way Unit G
- 18 Pine Cluster Cir Unit C