R
Seller's Agent in 2017
Roland Bousquet
Seacoast Mobile Home Brokers
(603) 692-7300
300 Total Sales
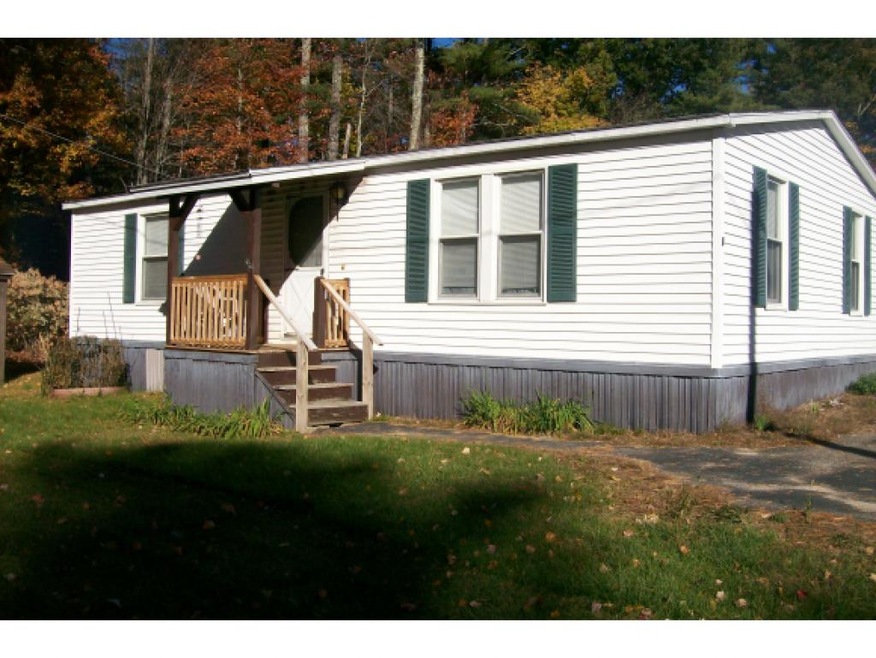
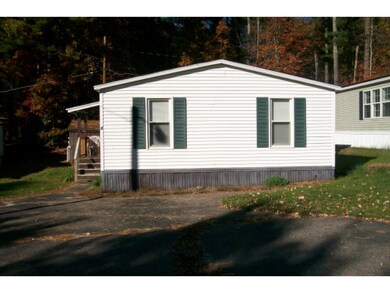
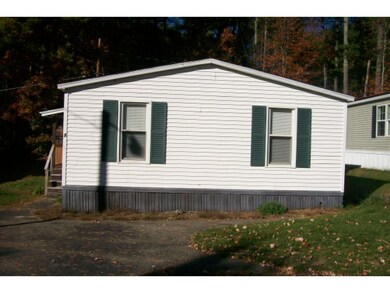
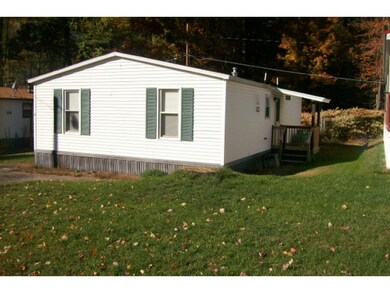
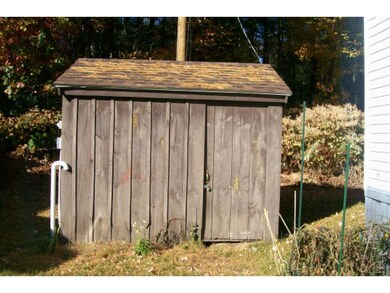

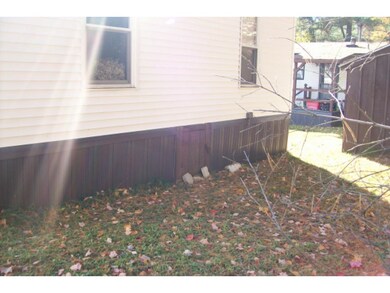
COOP Doublewide on a nice lot close to Lee traffic circle, shopping, and restaurants! Great looking home with a really large Livingroom that offers a diningroom area and pass through to kitchen and laundry/mudroom. The master bedroom is very large and the home has tilt in vinyl windows. This home is set up on a slab and there is a private backyard that backs to the trees. Good sized shed for storage and parking right in front of your home!!
Last Agent to Sell the Property
Seacoast Mobile Home Brokers License #033730 Listed on: 10/19/2015
Last Buyer's Agent
Seacoast Mobile Home Brokers License #033730 Listed on: 10/19/2015
| Date | Type | Sale Price | Title Company |
|---|---|---|---|
| Warranty Deed | -- | None Available | |
| Deed | $149,500 | -- |
| Date | Event | Price | Change | Sq Ft Price |
|---|---|---|---|---|
| 01/17/2017 01/17/17 | Sold | $32,900 | -17.5% | $35 / Sq Ft |
| 12/01/2016 12/01/16 | Pending | -- | -- | -- |
| 08/29/2016 08/29/16 | For Sale | $39,900 | +37.6% | $43 / Sq Ft |
| 01/20/2016 01/20/16 | Sold | $29,000 | -3.0% | $31 / Sq Ft |
| 11/28/2015 11/28/15 | Pending | -- | -- | -- |
| 10/19/2015 10/19/15 | For Sale | $29,900 | -- | $32 / Sq Ft |
| Year | Tax Paid | Tax Assessment Tax Assessment Total Assessment is a certain percentage of the fair market value that is determined by local assessors to be the total taxable value of land and additions on the property. | Land | Improvement |
|---|---|---|---|---|
| 2024 | $9,811 | $482,600 | $206,900 | $275,700 |
| 2023 | $9,884 | $482,600 | $206,900 | $275,700 |
| 2022 | $9,104 | $313,500 | $138,000 | $175,500 |
| 2021 | $8,739 | $313,100 | $137,600 | $175,500 |
| 2020 | $8,682 | $313,100 | $137,600 | $175,500 |
| 2019 | $8,588 | $313,100 | $137,600 | $175,500 |
| 2018 | $7,587 | $313,100 | $137,600 | $175,500 |
| 2017 | $7,173 | $271,800 | $105,700 | $166,100 |
| 2016 | $8,081 | $271,800 | $105,700 | $166,100 |
| 2015 | $8,113 | $271,800 | $105,700 | $166,100 |
| 2014 | $8,295 | $271,800 | $105,700 | $166,100 |
| 2013 | $8,165 | $268,500 | $105,700 | $162,800 |
R
Seller's Agent in 2017
Roland Bousquet
Seacoast Mobile Home Brokers
(603) 692-7300
300 Total Sales
Source: PrimeMLS
MLS Number: 4457020
APN: DRHM-000008-000001-000010
Disclaimer: Certain information contained herein is derived from information provided by parties other than Homes.com. All information provided is deemed reliable, but is not guaranteed to be accurate and should be independently verified.
![]() Copyright 2025 PrimeMLS, Inc. All rights reserved. This information is deemed reliable, but not guaranteed. The data relating to real estate displayed on this display comes in part from the IDX Program of PrimeMLS. The information being provided is for consumers’ personal, non-commercial use and may not be used for any purpose other than to identify prospective properties consumers may be interested in purchasing.
Copyright 2025 PrimeMLS, Inc. All rights reserved. This information is deemed reliable, but not guaranteed. The data relating to real estate displayed on this display comes in part from the IDX Program of PrimeMLS. The information being provided is for consumers’ personal, non-commercial use and may not be used for any purpose other than to identify prospective properties consumers may be interested in purchasing.
