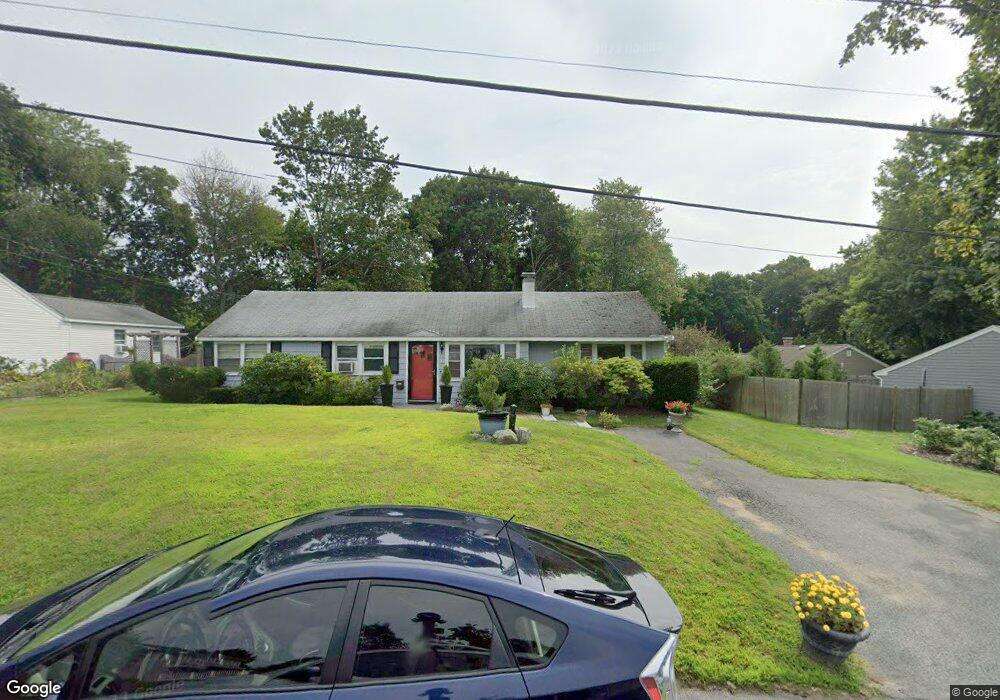
3 Pollock Rd Wayland, MA 01778
Estimated Value: $809,000 - $922,000
4
Beds
2
Baths
1,691
Sq Ft
$516/Sq Ft
Est. Value
About This Home
This home is located at 3 Pollock Rd, Wayland, MA 01778 and is currently estimated at $872,316, approximately $515 per square foot. 3 Pollock Rd is a home located in Middlesex County with nearby schools including Wayland High School, Veritas Christian Academy, and The Rivers School.
Ownership History
Date
Name
Owned For
Owner Type
Purchase Details
Closed on
Jul 22, 2003
Sold by
Parfenov Dmitri and Parfenova Vlada
Bought by
Grossman Seth
Current Estimated Value
Home Financials for this Owner
Home Financials are based on the most recent Mortgage that was taken out on this home.
Original Mortgage
$320,500
Outstanding Balance
$137,082
Interest Rate
5.34%
Mortgage Type
Purchase Money Mortgage
Estimated Equity
$735,234
Purchase Details
Closed on
Jun 25, 1998
Sold by
Bowers Charles P and Bowers Virginia C
Bought by
Parfenov Dmitri and Parfenov Vlada
Home Financials for this Owner
Home Financials are based on the most recent Mortgage that was taken out on this home.
Original Mortgage
$184,000
Interest Rate
6.99%
Create a Home Valuation Report for This Property
The Home Valuation Report is an in-depth analysis detailing your home's value as well as a comparison with similar homes in the area
Home Values in the Area
Average Home Value in this Area
Purchase History
| Date | Buyer | Sale Price | Title Company |
|---|---|---|---|
| Grossman Seth | $400,625 | -- | |
| Grossman Seth | $400,625 | -- | |
| Parfenov Dmitri | $230,000 | -- |
Source: Public Records
Mortgage History
| Date | Status | Borrower | Loan Amount |
|---|---|---|---|
| Open | Grossman Seth | $320,500 | |
| Closed | Parfenov Dmitri | $320,500 | |
| Previous Owner | Parfenov Dmitri | $285,000 | |
| Previous Owner | Parfenov Dmitri | $49,000 | |
| Previous Owner | Parfenov Dmitri | $184,000 |
Source: Public Records
Tax History
| Year | Tax Paid | Tax Assessment Tax Assessment Total Assessment is a certain percentage of the fair market value that is determined by local assessors to be the total taxable value of land and additions on the property. | Land | Improvement |
|---|---|---|---|---|
| 2025 | $11,538 | $738,200 | $491,400 | $246,800 |
| 2024 | $10,920 | $703,600 | $468,000 | $235,600 |
| 2023 | $10,609 | $637,200 | $425,400 | $211,800 |
| 2022 | $9,619 | $524,200 | $352,400 | $171,800 |
| 2021 | $4,386 | $490,900 | $320,300 | $170,600 |
| 2020 | $4,255 | $499,900 | $320,300 | $179,600 |
| 2019 | $4,092 | $477,900 | $305,100 | $172,800 |
| 2018 | $4,235 | $453,300 | $305,100 | $148,200 |
| 2017 | $7,873 | $434,000 | $290,500 | $143,500 |
| 2016 | $7,425 | $428,200 | $284,700 | $143,500 |
| 2015 | $7,875 | $428,200 | $284,700 | $143,500 |
Source: Public Records
Map
Nearby Homes
- 186 Main St
- 45 W Plain St Unit 1
- 136 Commonwealth Rd
- 340 N Main St
- 5 Haven Ln
- 5 Griffin Cir
- 201 Willow Brook Dr
- 123 Dudley Rd
- 138 W Plain St
- 108 Dudley Rd
- 6 Brewster Rd
- 22 Lake Shore Dr
- 85 Lake Road Terrace
- 58 Rice Rd
- 8 Liberty St
- 278 N Main St
- 29 Irving Rd
- 4 Richard Rd
- 26 Pine Ridge Rd
- 1 Richard Rd
Your Personal Tour Guide
Ask me questions while you tour the home.