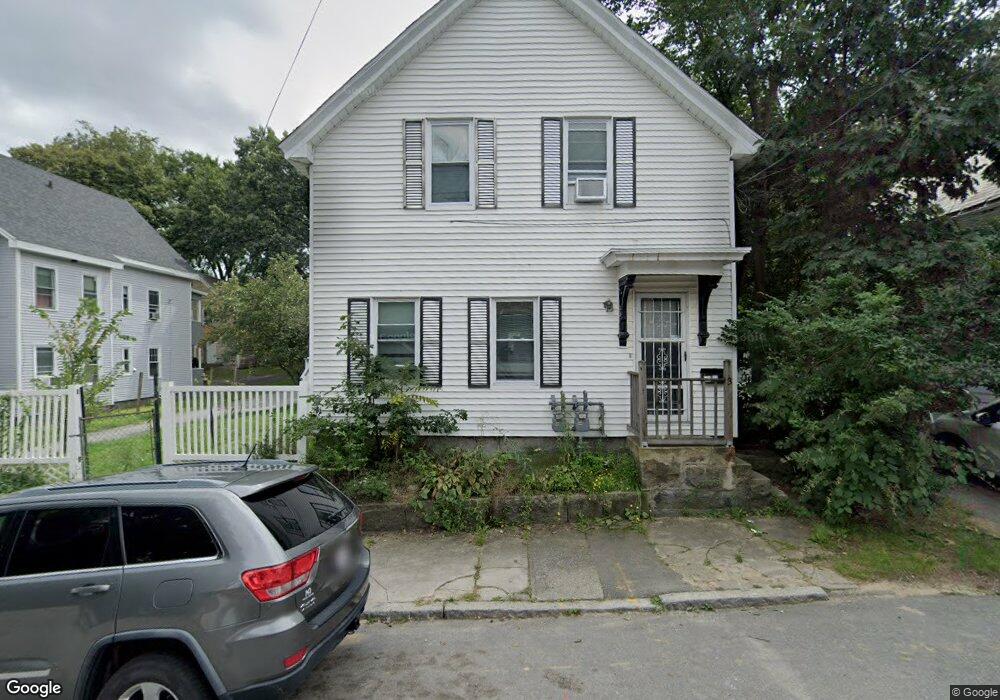
3 Prescott St Unit 2 Fitchburg, MA 01420
Estimated Value: $427,000 - $501,000
2
Beds
1
Bath
750
Sq Ft
$603/Sq Ft
Est. Value
About This Home
This home is located at 3 Prescott St Unit 2, Fitchburg, MA 01420 and is currently estimated at $451,953, approximately $602 per square foot. 3 Prescott St Unit 2 is a home located in Worcester County with nearby schools including South Street Elementary School, Crocker Elementary School, and Reingold Elementary School.
Ownership History
Date
Name
Owned For
Owner Type
Purchase Details
Closed on
Sep 26, 2008
Sold by
Us Bk and Csab Mtg Certificates
Bought by
Morais Allen
Current Estimated Value
Home Financials for this Owner
Home Financials are based on the most recent Mortgage that was taken out on this home.
Original Mortgage
$104,176
Outstanding Balance
$69,739
Interest Rate
6.57%
Mortgage Type
Purchase Money Mortgage
Estimated Equity
$382,214
Purchase Details
Closed on
Jun 12, 2006
Sold by
3 Prescott Rt and Zahos
Bought by
Vega Fernando
Home Financials for this Owner
Home Financials are based on the most recent Mortgage that was taken out on this home.
Original Mortgage
$188,000
Interest Rate
6.62%
Mortgage Type
Purchase Money Mortgage
Purchase Details
Closed on
Sep 29, 2004
Sold by
Gayzagian Michael
Bought by
3 Prescott Rt and Zahos
Home Financials for this Owner
Home Financials are based on the most recent Mortgage that was taken out on this home.
Original Mortgage
$180,400
Interest Rate
5.81%
Mortgage Type
Purchase Money Mortgage
Create a Home Valuation Report for This Property
The Home Valuation Report is an in-depth analysis detailing your home's value as well as a comparison with similar homes in the area
Home Values in the Area
Average Home Value in this Area
Purchase History
| Date | Buyer | Sale Price | Title Company |
|---|---|---|---|
| Morais Allen | $105,000 | -- | |
| Vega Fernando | $235,000 | -- | |
| 3 Prescott Rt | -- | -- | |
| Gayzagian Michael A | $225,000 | -- |
Source: Public Records
Mortgage History
| Date | Status | Borrower | Loan Amount |
|---|---|---|---|
| Open | Morais Allen | $104,176 | |
| Previous Owner | Vega Fernando | $188,000 | |
| Previous Owner | Vega Fernando | $47,000 | |
| Previous Owner | Gayzagian Michael A | $180,400 | |
| Previous Owner | Gayzagian Michael A | $22,500 |
Source: Public Records
Tax History Compared to Growth
Tax History
| Year | Tax Paid | Tax Assessment Tax Assessment Total Assessment is a certain percentage of the fair market value that is determined by local assessors to be the total taxable value of land and additions on the property. | Land | Improvement |
|---|---|---|---|---|
| 2025 | $48 | $357,500 | $87,600 | $269,900 |
| 2024 | $4,492 | $303,300 | $54,100 | $249,200 |
| 2023 | $4,260 | $265,900 | $41,500 | $224,400 |
| 2022 | $3,941 | $223,800 | $36,500 | $187,300 |
| 2021 | $3,530 | $185,500 | $27,700 | $157,800 |
| 2020 | $3,262 | $165,500 | $22,600 | $142,900 |
| 2019 | $3,020 | $147,400 | $31,500 | $115,900 |
| 2018 | $2,830 | $134,700 | $28,900 | $105,800 |
| 2017 | $2,549 | $118,600 | $26,400 | $92,200 |
| 2016 | $2,518 | $118,600 | $26,400 | $92,200 |
| 2015 | $2,395 | $115,800 | $27,700 | $88,100 |
| 2014 | $2,290 | $115,500 | $27,700 | $87,800 |
Source: Public Records
Map
Nearby Homes
- 3 Prescott St
- 1 Prescott St
- 5-7 Prescott St
- 57 Prescott St
- 5 Prescott St
- 24 Prescott St
- 2-4 Prescott St
- 23 Wilmot St
- 35 Brigham Park Unit 37
- 16 Wilmot St
- 16 Wilmot St Unit 1
- 39 Brigham Park Unit 41
- 19 Lawrence St
- 17 Wilmot St
- 12 Prescott St
- 23 Lawrence St Unit 2
- 43 Brigham Park
- 21 Lawrence St Unit 23
- 25 Lawrence St Unit 27
- 12 Wilmot St