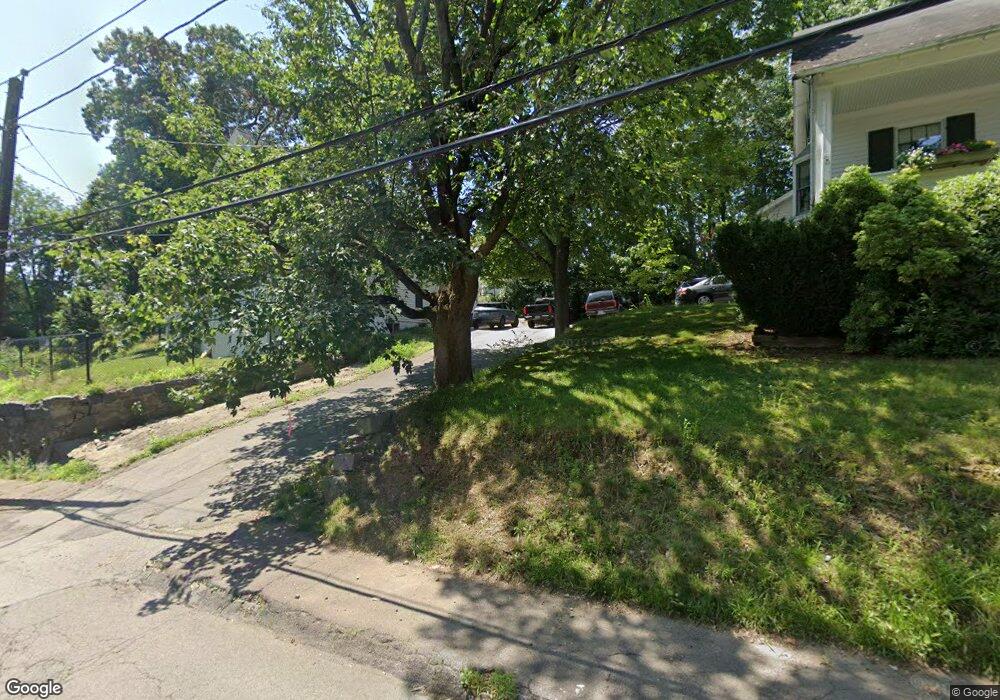
3 Primrose Cir Quincy, MA 02169
South Quincy NeighborhoodEstimated Value: $950,379 - $1,058,000
4
Beds
3
Baths
2,000
Sq Ft
$512/Sq Ft
Est. Value
About This Home
This home is located at 3 Primrose Cir, Quincy, MA 02169 and is currently estimated at $1,023,095, approximately $511 per square foot. 3 Primrose Cir is a home located in Norfolk County with nearby schools including Charles A. Bernazzani Elementary School, Central Middle School, and Quincy High School.
Ownership History
Date
Name
Owned For
Owner Type
Purchase Details
Closed on
Apr 23, 2010
Sold by
Perkins-Primrose Dev L
Bought by
Chinnapen Daniel J F and Chinnapen Himani U
Current Estimated Value
Home Financials for this Owner
Home Financials are based on the most recent Mortgage that was taken out on this home.
Original Mortgage
$369,750
Outstanding Balance
$246,266
Interest Rate
5%
Mortgage Type
Purchase Money Mortgage
Estimated Equity
$776,829
Create a Home Valuation Report for This Property
The Home Valuation Report is an in-depth analysis detailing your home's value as well as a comparison with similar homes in the area
Home Values in the Area
Average Home Value in this Area
Purchase History
| Date | Buyer | Sale Price | Title Company |
|---|---|---|---|
| Chinnapen Daniel J F | $493,000 | -- |
Source: Public Records
Mortgage History
| Date | Status | Borrower | Loan Amount |
|---|---|---|---|
| Open | Chinnapen Daniel J F | $369,750 |
Source: Public Records
Tax History Compared to Growth
Tax History
| Year | Tax Paid | Tax Assessment Tax Assessment Total Assessment is a certain percentage of the fair market value that is determined by local assessors to be the total taxable value of land and additions on the property. | Land | Improvement |
|---|---|---|---|---|
| 2025 | $10,611 | $920,300 | $312,100 | $608,200 |
| 2024 | $10,215 | $906,400 | $297,300 | $609,100 |
| 2023 | $9,455 | $849,500 | $283,200 | $566,300 |
| 2022 | $9,225 | $770,000 | $226,500 | $543,500 |
| 2021 | $9,139 | $752,800 | $226,500 | $526,300 |
| 2020 | $9,084 | $730,800 | $226,500 | $504,300 |
| 2019 | $8,919 | $710,700 | $220,000 | $490,700 |
| 2018 | $8,766 | $657,100 | $203,700 | $453,400 |
| 2017 | $8,563 | $604,300 | $194,000 | $410,300 |
| 2016 | $8,102 | $564,200 | $176,400 | $387,800 |
| 2015 | $7,614 | $521,500 | $166,400 | $355,100 |
| 2014 | $7,382 | $496,800 | $166,400 | $330,400 |
Source: Public Records
Map
Nearby Homes
- 230 Willard St Unit 204
- 47 Connell St
- 328 Copeland St Unit 3E
- 64 Willard St Unit 302
- 29 Oconnell Ave
- 19 Seymour St
- 27 Shirley St
- 9 Cross St Unit 11
- 141 Gardiner Rd
- 41 Filbert St
- 9 Common St Unit 3
- 2 Ricciuti Dr Unit 8
- 83 Forbes Hill Rd
- 211 Copeland St
- 28 Miller St Unit 8
- 37 Wren Terrace Unit 2
- 55 Lyons St Unit 1
- 86 Wren Terrace Unit A
- 1 Cityview Ln Unit 204
- 1 Cityview Ln Unit 506
- 1 Primrose Cir
- 5 Primrose Cir
- 22 Rogers St
- 22 Rogers St Unit House
- 2 Primrose Cir
- 230 Willard St Unit 812
- 230 Willard St Unit 811
- 230 Willard St Unit 810
- 230 Willard St Unit 809
- 230 Willard St Unit 807
- 230 Willard St Unit 806
- 230 Willard St Unit 805
- 230 Willard St Unit 804
- 230 Willard St Unit 803
- 230 Willard St Unit 801
- 230 Willard St Unit 712
- 230 Willard St Unit 711
- 230 Willard St Unit 710
- 230 Willard St Unit 709
- 230 Willard St Unit 708