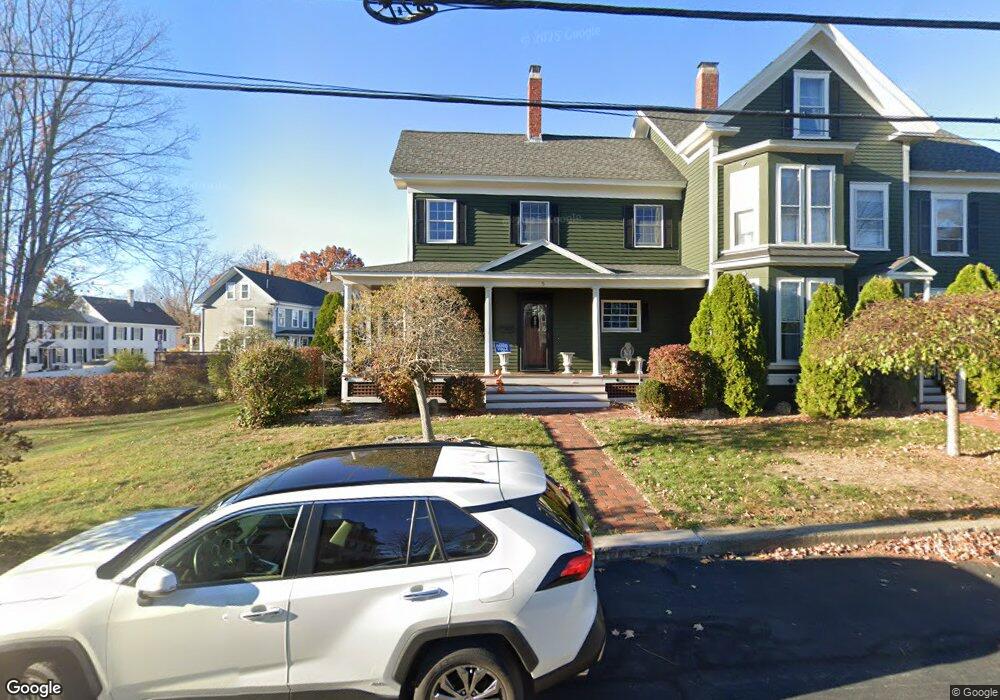
3 Prospect St Merrimac, MA 01860
Estimated Value: $618,000 - $975,062
5
Beds
3
Baths
2,796
Sq Ft
$286/Sq Ft
Est. Value
About This Home
This home is located at 3 Prospect St, Merrimac, MA 01860 and is currently estimated at $801,016, approximately $286 per square foot. 3 Prospect St is a home located in Essex County with nearby schools including Pentucket Regional High School.
Ownership History
Date
Name
Owned For
Owner Type
Purchase Details
Closed on
Oct 12, 2021
Sold by
Trombly Darlene J
Bought by
D J Trombly Ret 2021 and Trombley
Current Estimated Value
Purchase Details
Closed on
May 1, 2002
Sold by
Meuse Vincent P
Bought by
Trombly Darlene J
Create a Home Valuation Report for This Property
The Home Valuation Report is an in-depth analysis detailing your home's value as well as a comparison with similar homes in the area
Home Values in the Area
Average Home Value in this Area
Purchase History
| Date | Buyer | Sale Price | Title Company |
|---|---|---|---|
| D J Trombly Ret 2021 | -- | None Available | |
| Trombly Darlene J | $390,000 | -- |
Source: Public Records
Mortgage History
| Date | Status | Borrower | Loan Amount |
|---|---|---|---|
| Previous Owner | Trombly Darlene J | $70,000 | |
| Previous Owner | Trombly Darlene J | $242,000 | |
| Previous Owner | Trombly Darlene J | $60,000 |
Source: Public Records
Tax History Compared to Growth
Tax History
| Year | Tax Paid | Tax Assessment Tax Assessment Total Assessment is a certain percentage of the fair market value that is determined by local assessors to be the total taxable value of land and additions on the property. | Land | Improvement |
|---|---|---|---|---|
| 2025 | $8,891 | $671,000 | $300,500 | $370,500 |
| 2024 | $7,988 | $591,700 | $283,800 | $307,900 |
| 2023 | $8,098 | $548,300 | $240,400 | $307,900 |
| 2022 | $7,917 | $484,500 | $193,700 | $290,800 |
| 2021 | $7,754 | $475,700 | $177,000 | $298,700 |
| 2020 | $7,078 | $475,700 | $177,000 | $298,700 |
| 2019 | $6,756 | $427,300 | $153,600 | $273,700 |
| 2018 | $6,660 | $422,600 | $143,600 | $279,000 |
| 2017 | $6,523 | $399,200 | $120,200 | $279,000 |
| 2016 | $6,451 | $399,200 | $120,200 | $279,000 |
| 2015 | $6,190 | $380,900 | $120,200 | $260,700 |
| 2014 | $5,927 | $373,000 | $120,200 | $252,800 |
Source: Public Records
Map
Nearby Homes