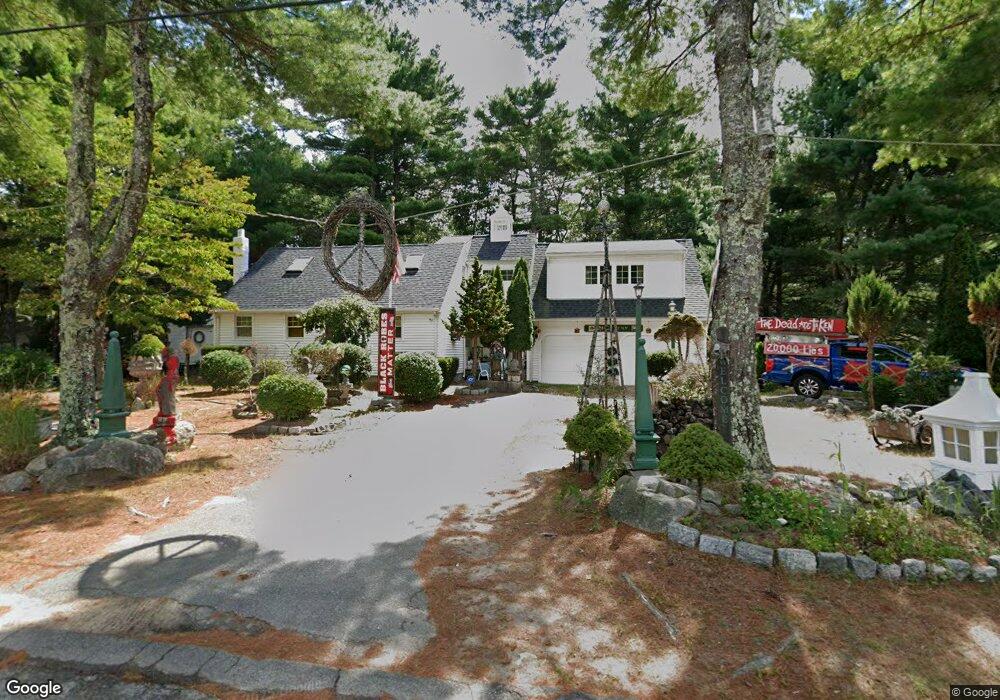
3 Quaker Rd Carver, MA 02330
Estimated Value: $625,199 - $732,000
3
Beds
3
Baths
1,970
Sq Ft
$347/Sq Ft
Est. Value
About This Home
This home is located at 3 Quaker Rd, Carver, MA 02330 and is currently estimated at $684,300, approximately $347 per square foot. 3 Quaker Rd is a home located in Plymouth County with nearby schools including Carver Elementary School, Carver Middle/High School, and Samuel Fuller School.
Ownership History
Date
Name
Owned For
Owner Type
Purchase Details
Closed on
Dec 22, 2004
Sold by
Mccarthy Wayne A
Bought by
Mccarthy Wayne A and Sullivan Thomas P
Current Estimated Value
Home Financials for this Owner
Home Financials are based on the most recent Mortgage that was taken out on this home.
Original Mortgage
$298,000
Outstanding Balance
$149,338
Interest Rate
5.74%
Mortgage Type
Purchase Money Mortgage
Estimated Equity
$534,962
Create a Home Valuation Report for This Property
The Home Valuation Report is an in-depth analysis detailing your home's value as well as a comparison with similar homes in the area
Home Values in the Area
Average Home Value in this Area
Purchase History
| Date | Buyer | Sale Price | Title Company |
|---|---|---|---|
| Mccarthy Wayne A | -- | -- |
Source: Public Records
Mortgage History
| Date | Status | Borrower | Loan Amount |
|---|---|---|---|
| Open | Mccarthy Wayne A | $298,000 | |
| Previous Owner | Mccarthy Wayne A | $60,000 |
Source: Public Records
Tax History
| Year | Tax Paid | Tax Assessment Tax Assessment Total Assessment is a certain percentage of the fair market value that is determined by local assessors to be the total taxable value of land and additions on the property. | Land | Improvement |
|---|---|---|---|---|
| 2025 | $7,158 | $516,100 | $130,800 | $385,300 |
| 2024 | $6,804 | $480,200 | $128,300 | $351,900 |
| 2023 | $6,542 | $448,400 | $128,300 | $320,100 |
| 2022 | $6,251 | $391,200 | $109,700 | $281,500 |
| 2021 | $5,973 | $352,600 | $97,900 | $254,700 |
| 2020 | $5,752 | $334,600 | $91,500 | $243,100 |
| 2019 | $5,553 | $325,700 | $88,800 | $236,900 |
| 2018 | $5,233 | $296,800 | $88,800 | $208,000 |
| 2017 | $5,017 | $283,600 | $85,500 | $198,100 |
| 2016 | $4,661 | $273,700 | $81,400 | $192,300 |
| 2015 | $4,537 | $266,700 | $81,400 | $185,300 |
| 2014 | $4,426 | $260,200 | $102,900 | $157,300 |
Source: Public Records
Map
Nearby Homes
- 35 Silva St
- 11 Brockton Ave
- 67 Crystal Lake Dr
- 26 Santana Way Unit 26
- 89 Silva St
- 81 Center St
- 40 Fosdick Rd
- 7 Cedar Dr
- 70 Wall St
- 235 Main St
- Lot1 Elk Run Dr
- 6 Susan Cir
- 11 Opal Ave
- 43 S Meadow Rd
- 13 Pond View Way
- 56 Bunnys Rd
- 114 Meadow St
- 6 Twin Pines Ln Unit 6
- 48 S Meadow Village
- 29 S Meadow Village
Your Personal Tour Guide
Ask me questions while you tour the home.