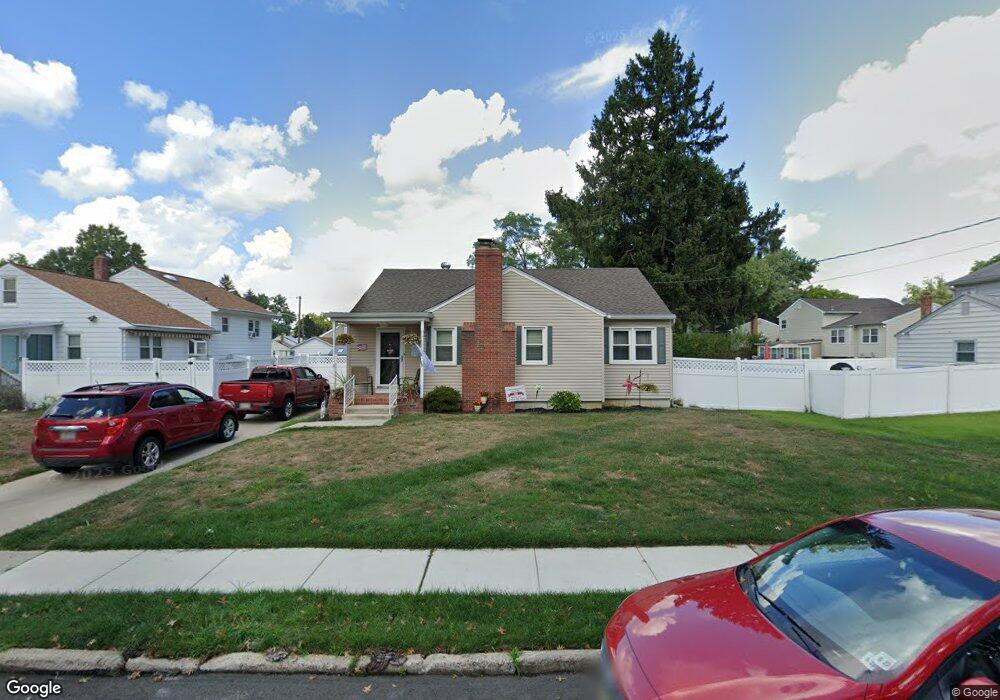
3 Randolph Dr Mount Holly, NJ 08060
Estimated Value: $289,978 - $361,000
--
Bed
--
Bath
1,140
Sq Ft
$294/Sq Ft
Est. Value
About This Home
This home is located at 3 Randolph Dr, Mount Holly, NJ 08060 and is currently estimated at $335,245, approximately $294 per square foot. 3 Randolph Dr is a home located in Burlington County with nearby schools including John Brainerd Elementary School, Folwell Elementary School, and F.W. Holbein School.
Ownership History
Date
Name
Owned For
Owner Type
Purchase Details
Closed on
Dec 1, 1998
Sold by
Rano Paul A and Schwartz Rano Tiffany A
Bought by
Loesche Frank J and Loesche Jennifer L
Current Estimated Value
Home Financials for this Owner
Home Financials are based on the most recent Mortgage that was taken out on this home.
Original Mortgage
$95,950
Outstanding Balance
$21,908
Interest Rate
6.84%
Mortgage Type
Purchase Money Mortgage
Estimated Equity
$313,337
Purchase Details
Closed on
Feb 9, 1996
Sold by
Alexander Jeffrey L and Alexander Jeffrey J
Bought by
Rano Paul A and Schwartz Rano Tiffany A
Create a Home Valuation Report for This Property
The Home Valuation Report is an in-depth analysis detailing your home's value as well as a comparison with similar homes in the area
Home Values in the Area
Average Home Value in this Area
Purchase History
| Date | Buyer | Sale Price | Title Company |
|---|---|---|---|
| Loesche Frank J | $101,000 | Weichert Title Agency | |
| Rano Paul A | $95,000 | Lawrence Abstract Company |
Source: Public Records
Mortgage History
| Date | Status | Borrower | Loan Amount |
|---|---|---|---|
| Open | Loesche Frank J | $95,950 |
Source: Public Records
Tax History Compared to Growth
Tax History
| Year | Tax Paid | Tax Assessment Tax Assessment Total Assessment is a certain percentage of the fair market value that is determined by local assessors to be the total taxable value of land and additions on the property. | Land | Improvement |
|---|---|---|---|---|
| 2025 | $6,530 | $186,000 | $60,600 | $125,400 |
| 2024 | $6,242 | $186,000 | $60,600 | $125,400 |
| 2023 | $6,242 | $186,000 | $60,600 | $125,400 |
| 2022 | $6,023 | $186,000 | $60,600 | $125,400 |
| 2021 | $5,924 | $186,000 | $60,600 | $125,400 |
| 2020 | $5,693 | $186,000 | $60,600 | $125,400 |
| 2019 | $5,565 | $186,000 | $60,600 | $125,400 |
| 2018 | $5,467 | $186,000 | $60,600 | $125,400 |
| 2017 | $5,325 | $186,000 | $60,600 | $125,400 |
| 2016 | $5,202 | $186,000 | $60,600 | $125,400 |
| 2015 | $5,093 | $186,000 | $60,600 | $125,400 |
| 2014 | $4,905 | $186,000 | $60,600 | $125,400 |
Source: Public Records
Map
Nearby Homes