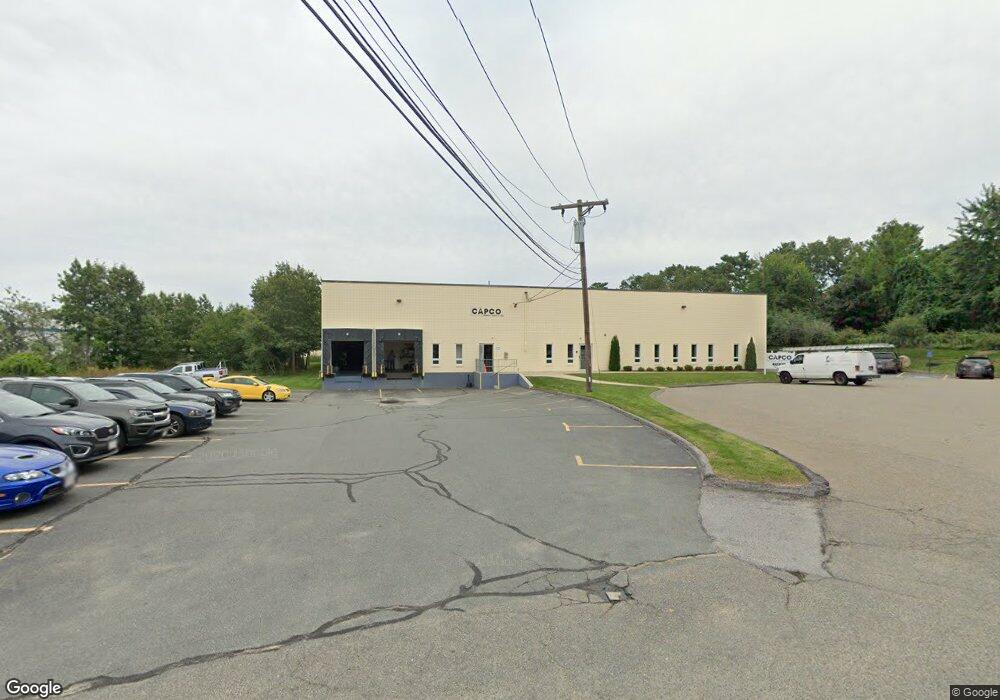
3 Rath Rd Woburn, MA 01801
Mishawum NeighborhoodEstimated Value: $4,950,719
Studio
3
Baths
18,861
Sq Ft
$262/Sq Ft
Est. Value
About This Home
This home is located at 3 Rath Rd, Woburn, MA 01801 and is currently estimated at $4,950,719, approximately $262 per square foot. 3 Rath Rd is a home located in Middlesex County with nearby schools including Mary D. Altavesta Elementary School, John F. Kennedy Middle School, and Woburn High School.
Ownership History
Date
Name
Owned For
Owner Type
Purchase Details
Closed on
Dec 20, 2021
Sold by
Rath Rd Llc
Bought by
Kj Woburn Llc
Current Estimated Value
Home Financials for this Owner
Home Financials are based on the most recent Mortgage that was taken out on this home.
Original Mortgage
$3,360,000
Outstanding Balance
$3,063,895
Interest Rate
3.09%
Mortgage Type
Purchase Money Mortgage
Estimated Equity
$1,886,824
Purchase Details
Closed on
Mar 16, 2015
Sold by
Godett Nt and Godett
Bought by
Rath Rd Llc
Home Financials for this Owner
Home Financials are based on the most recent Mortgage that was taken out on this home.
Original Mortgage
$1,050,000
Interest Rate
3.67%
Mortgage Type
Commercial
Create a Home Valuation Report for This Property
The Home Valuation Report is an in-depth analysis detailing your home's value as well as a comparison with similar homes in the area
Home Values in the Area
Average Home Value in this Area
Purchase History
| Date | Buyer | Sale Price | Title Company |
|---|---|---|---|
| Kj Woburn Llc | $4,200,000 | None Available | |
| Rath Rd Llc | $1,250,000 | -- |
Source: Public Records
Mortgage History
| Date | Status | Borrower | Loan Amount |
|---|---|---|---|
| Open | Kj Woburn Llc | $3,360,000 | |
| Previous Owner | Rath Rd Llc | $1,050,000 |
Source: Public Records
Tax History
| Year | Tax Paid | Tax Assessment Tax Assessment Total Assessment is a certain percentage of the fair market value that is determined by local assessors to be the total taxable value of land and additions on the property. | Land | Improvement |
|---|---|---|---|---|
| 2025 | $50,378 | $2,468,300 | $412,000 | $2,056,300 |
| 2024 | $47,413 | $2,404,300 | $412,000 | $1,992,300 |
| 2023 | $46,552 | $2,202,100 | $412,000 | $1,790,100 |
| 2022 | $43,381 | $1,905,200 | $412,000 | $1,493,200 |
| 2021 | $39,331 | $1,720,500 | $412,000 | $1,308,500 |
| 2020 | $39,916 | $1,720,500 | $412,000 | $1,308,500 |
| 2019 | $38,277 | $1,613,700 | $412,000 | $1,201,700 |
| 2018 | $39,725 | $1,592,200 | $394,100 | $1,198,100 |
| 2017 | $39,063 | $1,564,400 | $394,100 | $1,170,300 |
| 2016 | $32,751 | $1,269,900 | $394,100 | $875,800 |
| 2015 | $33,398 | $1,269,900 | $362,000 | $907,900 |
| 2014 | $32,977 | $1,203,100 | $362,000 | $841,100 |
Source: Public Records
Map
Nearby Homes
- 6 Callahan Dr
- 14 Woodside Terrace
- 9 Cottage St
- 0 Fryeburg Rd
- 7 E Dexter Ave Unit 33
- 1 Garvey Rd Unit 1
- 22 Longwood Ave
- 40 Beach St
- 26 Lothrop Rd
- 13 West St
- 75 Whitehall Ln
- 45 Lowell St
- 23 Ward St Unit A
- 29 Louanis Dr
- 44 Pearl St
- 6 Kendal Dr
- 18 Montvale Rd
- 166 Place Ln Unit 166
- 380 Place Ln
- 1011 Main St Unit 5
Your Personal Tour Guide
Ask me questions while you tour the home.