w
Landlord's Agent in 2019
warren Hipwell
Real Estate Rocks


Estimated Value: $788,000 - $1,526,000
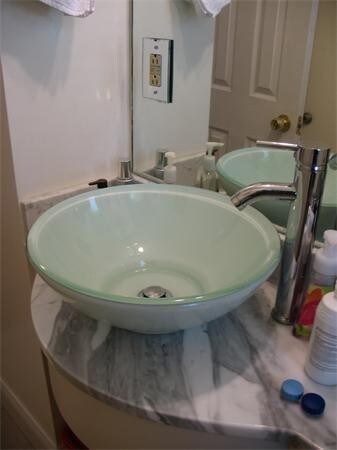
Beautiful Furnished 4 level townhouse located in Lower Allston near Harvard Stadium!. Walk to Harvard Business School! Bus to Harvard Sq in 5 Minutes! German school is right around the corner! Great location for BU commuters dream with easy access to Soldiers Field Road and the Mass Pike.Very close to grocery stores (such as Trader Joe's and Star Market,shopping and restaurants This spacious townhouse has gleaming hardwood floors throughout,4 levels of living space,a master suite on the top floor,a freshly painted, finished lower level with a newly tiled floor,LG washer and dryer,and room for an additional bedroom or family room,large private patio,deeded parking space,AC,granite counters,4 large flat screen TV's and more!
Last Agent to Rent the Property
warren Hipwell
Real Estate Rocks License #449546858 Listed on: 03/18/2019
Last Renter's Agent
warren Hipwell
Real Estate Rocks License #449546858 Listed on: 03/18/2019
| Date | Buyer | Sale Price | Title Company |
|---|---|---|---|
| Lau Tsui S | -- | -- | |
| Lau Angel Y | -- | -- | |
| Lau T S | $231,000 | -- |
| Date | Status | Borrower | Loan Amount |
|---|---|---|---|
| Previous Owner | Lau T S | $260,000 | |
| Previous Owner | Lau T S | $236,000 | |
| Previous Owner | Lau T S | $150,000 |
| Date | Event | Price | List to Sale | Price per Sq Ft |
|---|---|---|---|---|
| 04/23/2019 04/23/19 | Rented | $3,500 | 0.0% | -- |
| 04/23/2019 04/23/19 | Under Contract | -- | -- | -- |
| 03/18/2019 03/18/19 | For Rent | $3,500 | -- | -- |
| Year | Tax Paid | Tax Assessment Tax Assessment Total Assessment is a certain percentage of the fair market value that is determined by local assessors to be the total taxable value of land and additions on the property. | Land | Improvement |
|---|---|---|---|---|
| 2025 | $8,809 | $760,700 | $0 | $760,700 |
| 2024 | $6,602 | $605,700 | $0 | $605,700 |
| 2023 | $6,079 | $566,000 | $0 | $566,000 |
| 2022 | $5,756 | $529,000 | $0 | $529,000 |
| 2021 | $5,644 | $529,000 | $0 | $529,000 |
| 2020 | $5,244 | $496,600 | $0 | $496,600 |
| 2019 | $4,674 | $443,500 | $0 | $443,500 |
| 2018 | $4,384 | $418,300 | $0 | $418,300 |
| 2017 | $4,103 | $387,400 | $0 | $387,400 |
| 2016 | $3,909 | $355,400 | $0 | $355,400 |
| 2015 | $4,401 | $363,400 | $0 | $363,400 |
| 2014 | $4,139 | $329,000 | $0 | $329,000 |
w
Landlord's Agent in 2019
warren Hipwell
Real Estate Rocks
Source: MLS Property Information Network (MLS PIN)
MLS Number: 72466615
APN: ALLS-000000-000022-001172-000020
Disclaimer: Certain information contained herein is derived from information provided by parties other than Homes.com. All information provided is deemed reliable, but is not guaranteed to be accurate and should be independently verified.
![]() The property listing data and information, or the Images, set forth herein were provided to MLS Property Information Network, Inc. from third party sources, including sellers, lessors and public records, and were compiled by MLS Property Information Network, Inc. The property listing data and information, and the Images, are for the personal, non-commercial use of consumers having a good faith interest in purchasing or leasing listed properties of the type displayed to them and may not be used for any purpose other than to identify prospective properties which such consumers may have a good faith interest in purchasing or leasing. MLS Property Information Network, Inc. and its subscribers disclaim any and all representations and warranties as to the accuracy of the property listing data and information, or as to the accuracy of any of the Images, set forth herein.
The property listing data and information, or the Images, set forth herein were provided to MLS Property Information Network, Inc. from third party sources, including sellers, lessors and public records, and were compiled by MLS Property Information Network, Inc. The property listing data and information, and the Images, are for the personal, non-commercial use of consumers having a good faith interest in purchasing or leasing listed properties of the type displayed to them and may not be used for any purpose other than to identify prospective properties which such consumers may have a good faith interest in purchasing or leasing. MLS Property Information Network, Inc. and its subscribers disclaim any and all representations and warranties as to the accuracy of the property listing data and information, or as to the accuracy of any of the Images, set forth herein.
Ask me questions while you tour the home.
