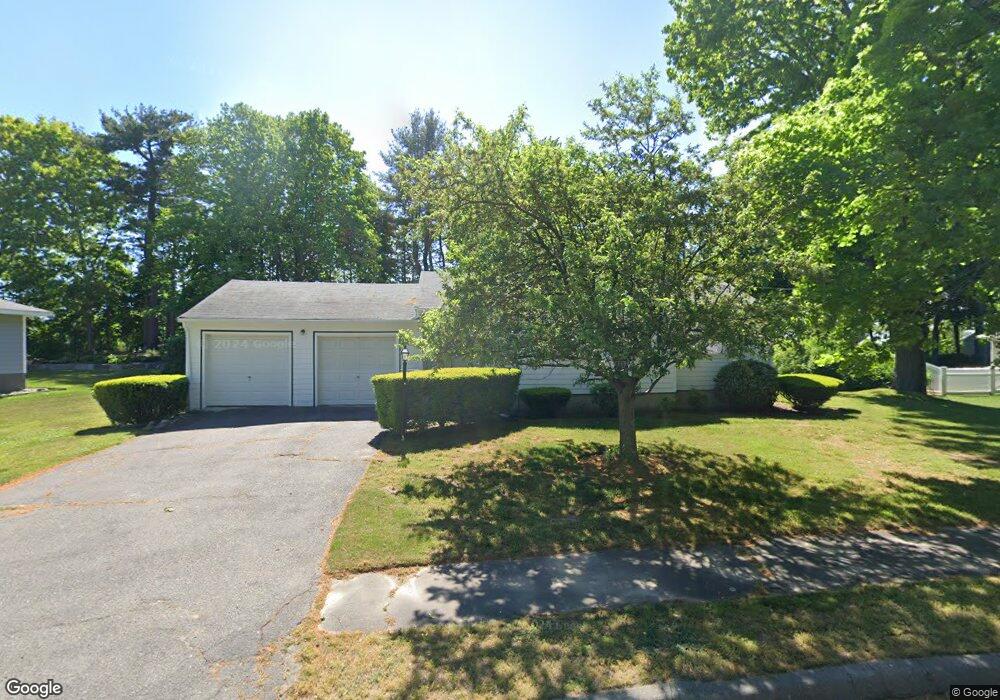
3 Reedy Rd Lynnfield, MA 01940
Estimated Value: $778,000 - $939,000
3
Beds
1
Bath
1,204
Sq Ft
$701/Sq Ft
Est. Value
About This Home
This home is located at 3 Reedy Rd, Lynnfield, MA 01940 and is currently estimated at $844,457, approximately $701 per square foot. 3 Reedy Rd is a home located in Essex County with nearby schools including Lynnfield Middle School, Pickering Middle School, and Lynnfield High School.
Ownership History
Date
Name
Owned For
Owner Type
Purchase Details
Closed on
Sep 9, 2022
Sold by
Arline E Cohee Irt and Cohec
Bought by
Gordon Matthew J and Gordon Myla M
Current Estimated Value
Home Financials for this Owner
Home Financials are based on the most recent Mortgage that was taken out on this home.
Original Mortgage
$572,000
Outstanding Balance
$545,170
Interest Rate
5.3%
Mortgage Type
Purchase Money Mortgage
Estimated Equity
$299,287
Purchase Details
Closed on
Jan 17, 2018
Sold by
Cohee Arline E
Bought by
Arline E Cohee Irt
Create a Home Valuation Report for This Property
The Home Valuation Report is an in-depth analysis detailing your home's value as well as a comparison with similar homes in the area
Home Values in the Area
Average Home Value in this Area
Purchase History
| Date | Buyer | Sale Price | Title Company |
|---|---|---|---|
| Gordon Matthew J | $715,000 | None Available | |
| Arline E Cohee Irt | -- | -- | |
| Arline E Cohee Irt | -- | -- |
Source: Public Records
Mortgage History
| Date | Status | Borrower | Loan Amount |
|---|---|---|---|
| Open | Gordon Matthew J | $572,000 |
Source: Public Records
Tax History Compared to Growth
Tax History
| Year | Tax Paid | Tax Assessment Tax Assessment Total Assessment is a certain percentage of the fair market value that is determined by local assessors to be the total taxable value of land and additions on the property. | Land | Improvement |
|---|---|---|---|---|
| 2025 | $7,884 | $746,600 | $564,100 | $182,500 |
| 2024 | $7,545 | $717,900 | $542,400 | $175,500 |
| 2023 | $7,647 | $676,700 | $514,400 | $162,300 |
| 2022 | $7,346 | $612,700 | $472,400 | $140,300 |
| 2021 | $6,879 | $518,400 | $384,900 | $133,500 |
| 2020 | $6,657 | $478,200 | $344,700 | $133,500 |
| 2019 | $6,652 | $478,200 | $344,700 | $133,500 |
| 2018 | $6,486 | $471,400 | $344,700 | $126,700 |
| 2017 | $6,326 | $459,100 | $332,400 | $126,700 |
| 2016 | $5,990 | $413,100 | $285,200 | $127,900 |
| 2015 | $5,884 | $406,100 | $284,100 | $122,000 |
Source: Public Records
Map
Nearby Homes