3 Rip Tide Dr Westerly, RI 02891
Westerly AreaEstimated Value: $875,000 - $982,000
About This Home
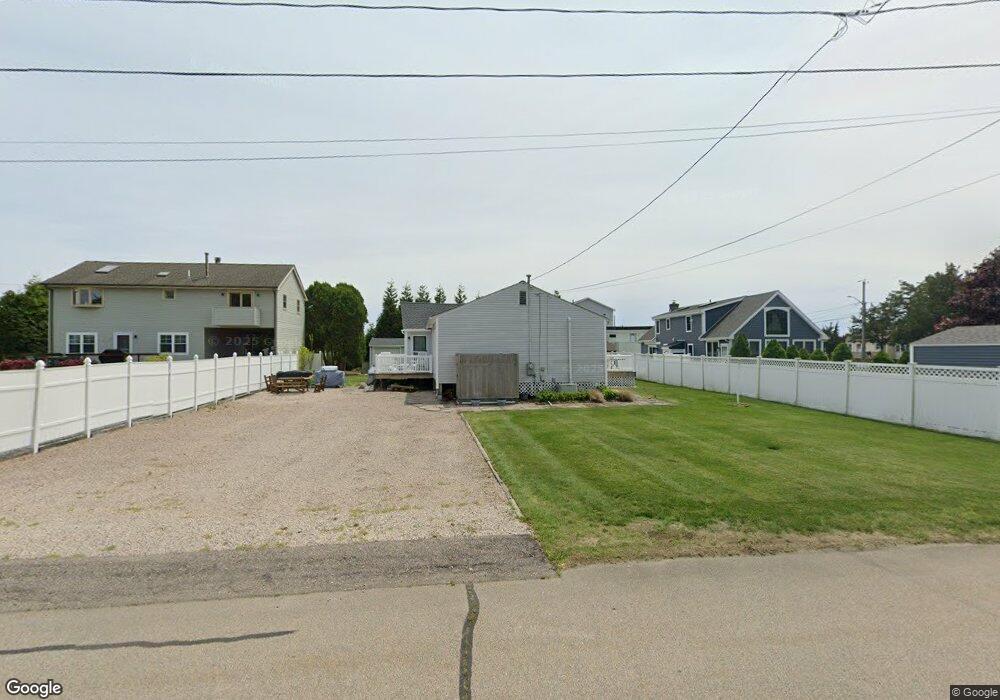
This home is located at 3 Rip Tide Dr, Westerly, RI 02891 and is currently estimated at $940,295, approximately $887 per square foot. 3 Rip Tide Dr is a home with nearby schools including Westerly High School and St. Michael School.
Ownership History
We collect this data history from publicly available records. To have your information removed, we recommend requesting removal directly through your county’s website.
Purchase Details
Home Values in the Area
Average Home Value in this Area
Purchase History
We collect this data history from publicly available records. To have your information removed, we recommend requesting removal directly through your county’s website.
| Date | Buyer | Sale Price | Title Company |
|---|---|---|---|
| $115,000 | -- |
Tax History
We collect this data history from publicly available records. To have your information removed, we recommend requesting removal directly through your county’s website.
| Year | Tax Paid | Tax Assessment Tax Assessment Total Assessment is a certain percentage of the fair market value that is determined by local assessors to be the total taxable value of land and additions on the property. | Land | Improvement |
|---|---|---|---|---|
| 2025 | $5,861 | $824,300 | $643,300 | $181,000 |
| 2024 | $5,942 | $605,700 | $459,800 | $145,900 |
| 2023 | $5,827 | $605,700 | $459,800 | $145,900 |
| 2022 | $5,790 | $605,700 | $459,800 | $145,900 |
| 2021 | $5,102 | $442,900 | $333,400 | $109,500 |
| 2020 | $5,009 | $442,900 | $333,400 | $109,500 |
| 2019 | $4,960 | $442,900 | $333,400 | $109,500 |
| 2018 | $4,694 | $395,100 | $303,100 | $92,000 |
| 2017 | $4,579 | $395,100 | $303,100 | $92,000 |
| 2016 | $4,615 | $395,100 | $303,100 | $92,000 |
| 2015 | $4,496 | $415,500 | $309,300 | $106,200 |
| 2014 | $4,421 | $415,500 | $309,300 | $106,200 |
Map
- 17 Lawton Ave
- 12 Montauk Ave
- 16 Rabbit Run
- 27 Benson Ave
- 49 Benson Ave
- 26 Crandall Ave
- 24 Crandall Ave
- 121 Winnapaug Rd
- 9 Compass Way Unit 302
- 1 Compass Way Unit A103
- 6 S Essex Dr
- 13 No Bottom Ridge Rd
- 26 Windward Dr
- 319 Atlantic Ave Unit 13
- 18 E Hills Rd
- 18 No Bottom Ridge Ridge
- 9 Newbury Dr
- 20 Vio Roma Rd
- 26 E Hills Rd
- 4 Shore Rd
- 4 Rip Tide Dr
- 6 Rip Tide Dr
- 35 Montauk Ave
- 39 Montauk Ave
- 41 Montauk Ave
- 483 Old Town Rd
- 5 Rip Tide Dr
- 5 Rip Tide Dr Unit 1st floor
- 38 Montauk Ave
- 36 Montauk Ave
- 31 Montauk Ave
- 34 Montauk Ave
- 40 Montauk Ave
- 7 Rip Tide Dr
- 44 Winnapaug Rd
- 46 Winnapaug Rd
- 43 Montauk Ave
- 48 Winnapaug Rd
- 32 Montauk Ave
- 9 Rip Tide Dr
Ask me questions while you tour the home.