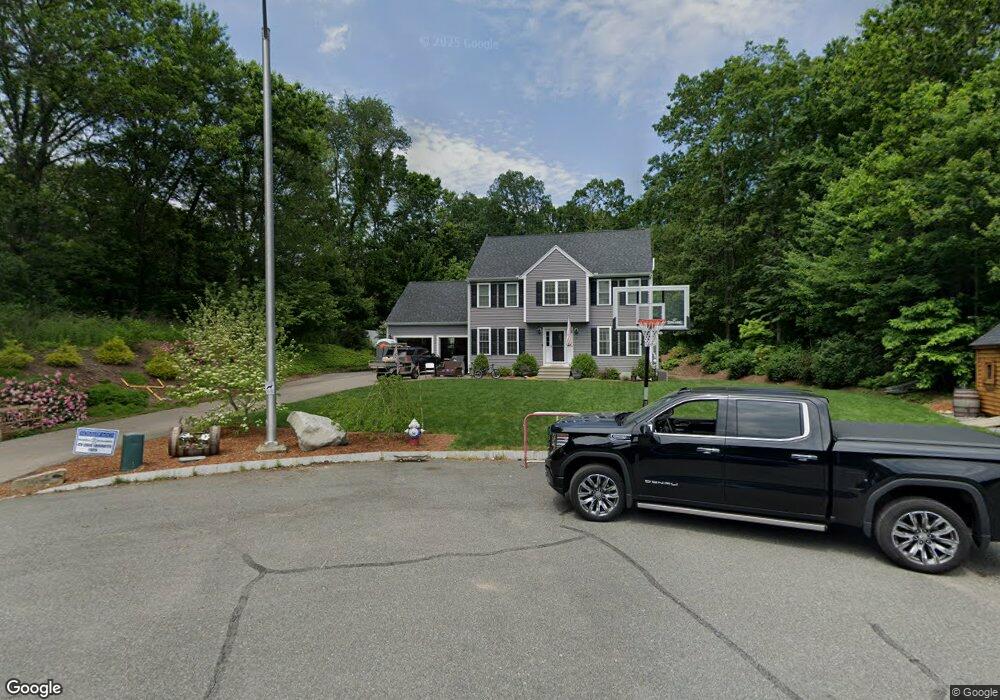
3 Rothchild Dr Foxboro, MA 02035
Estimated Value: $855,919 - $914,000
3
Beds
4
Baths
2,092
Sq Ft
$426/Sq Ft
Est. Value
About This Home
This home is located at 3 Rothchild Dr, Foxboro, MA 02035 and is currently estimated at $891,730, approximately $426 per square foot. 3 Rothchild Dr is a home with nearby schools including Foxborough High School, St Mary's Catholic School, and Hands-On-Montessori School.
Ownership History
Date
Name
Owned For
Owner Type
Purchase Details
Closed on
Jul 11, 2013
Sold by
Jake Dev Llc
Bought by
Mccue Matthew R and Mccue Chelsea C
Current Estimated Value
Home Financials for this Owner
Home Financials are based on the most recent Mortgage that was taken out on this home.
Original Mortgage
$348,000
Outstanding Balance
$242,930
Interest Rate
3%
Mortgage Type
New Conventional
Estimated Equity
$648,800
Create a Home Valuation Report for This Property
The Home Valuation Report is an in-depth analysis detailing your home's value as well as a comparison with similar homes in the area
Home Values in the Area
Average Home Value in this Area
Purchase History
| Date | Buyer | Sale Price | Title Company |
|---|---|---|---|
| Mccue Matthew R | $435,000 | -- | |
| Mccue Matthew R | $435,000 | -- |
Source: Public Records
Mortgage History
| Date | Status | Borrower | Loan Amount |
|---|---|---|---|
| Open | Mccue Matthew R | $348,000 | |
| Closed | Mccue Matthew R | $348,000 |
Source: Public Records
Tax History Compared to Growth
Tax History
| Year | Tax Paid | Tax Assessment Tax Assessment Total Assessment is a certain percentage of the fair market value that is determined by local assessors to be the total taxable value of land and additions on the property. | Land | Improvement |
|---|---|---|---|---|
| 2025 | $9,440 | $714,100 | $293,400 | $420,700 |
| 2024 | $9,480 | $701,700 | $298,100 | $403,600 |
| 2023 | $9,170 | $645,300 | $284,300 | $361,000 |
| 2022 | $8,501 | $585,500 | $239,300 | $346,200 |
| 2021 | $8,290 | $562,400 | $221,900 | $340,500 |
| 2020 | $8,047 | $552,300 | $221,900 | $330,400 |
| 2019 | $7,762 | $528,000 | $211,500 | $316,500 |
| 2018 | $7,632 | $523,800 | $211,500 | $312,300 |
| 2017 | $7,391 | $491,400 | $197,900 | $293,500 |
| 2016 | $6,890 | $464,900 | $199,600 | $265,300 |
| 2015 | $6,811 | $448,400 | $169,500 | $278,900 |
| 2014 | $6,479 | $432,200 | $158,700 | $273,500 |
Source: Public Records
Map
Nearby Homes
- 5 Lauren Ln
- 67 Morse St
- 619 N Main St
- 261 East St
- 44 Angell St Unit 44
- 60 King St
- 28 Angell St
- 82 Brook St
- 12 Community Way
- 55-57 Pine Needle Ln
- 25 Winter St
- 99 Pleasant St
- 409 Pratt St
- 22 Pleasant St Unit A
- 22 Pleasant St Unit B
- 9 Independence Dr Unit 9
- 35 Independence Dr Unit 35
- 356 Central St
- 150 Rumford Ave Unit 222
- 3 Cushing Ln