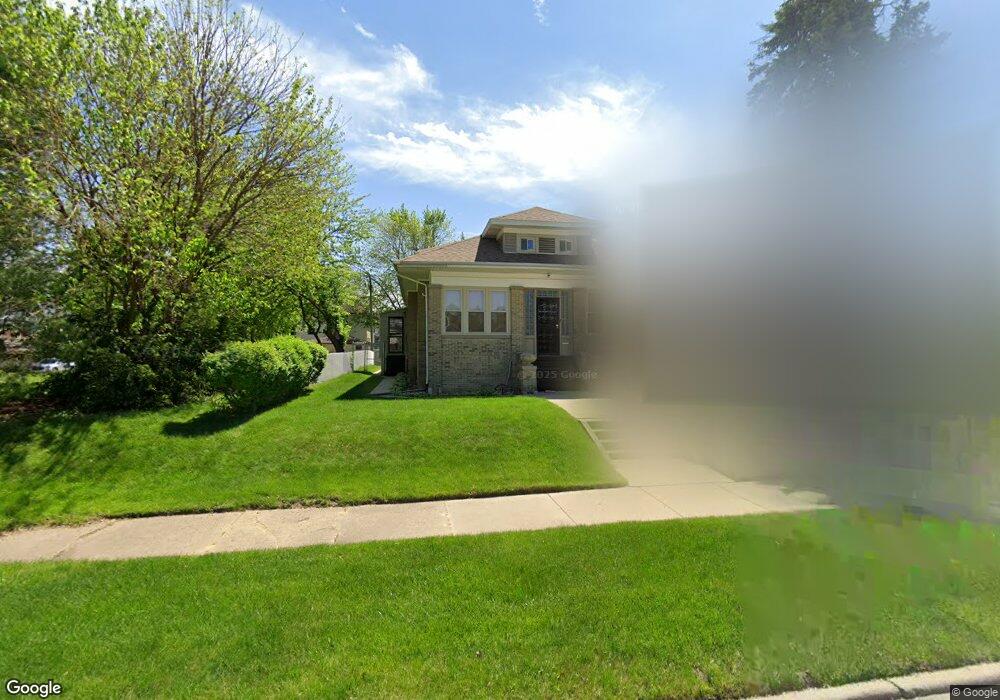
3 Ruth St Calumet City, IL 60409
Estimated Value: $184,000 - $246,000
4
Beds
2
Baths
1,604
Sq Ft
$131/Sq Ft
Est. Value
About This Home
This home is located at 3 Ruth St, Calumet City, IL 60409 and is currently estimated at $210,536, approximately $131 per square foot. 3 Ruth St is a home located in Cook County with nearby schools including Lincoln Elementary School, Thornton Fractional North High School, and Hammond Academy Of Science & Tech.
Ownership History
Date
Name
Owned For
Owner Type
Purchase Details
Closed on
Aug 1, 2013
Sold by
Fair Janice and Bevins Timothy
Bought by
Fair Janice and Bevins Timothy
Current Estimated Value
Home Financials for this Owner
Home Financials are based on the most recent Mortgage that was taken out on this home.
Original Mortgage
$95,000
Outstanding Balance
$22,712
Interest Rate
3.62%
Mortgage Type
New Conventional
Estimated Equity
$187,824
Purchase Details
Closed on
Jan 8, 2007
Sold by
Fair Delucia
Bought by
Fair Janice
Purchase Details
Closed on
Nov 15, 1994
Sold by
Kozakiewicz Norbert J and Kozakiewicz Carol J
Bought by
Fair Janice M and Fair Deluchia
Home Financials for this Owner
Home Financials are based on the most recent Mortgage that was taken out on this home.
Original Mortgage
$74,642
Interest Rate
9%
Mortgage Type
FHA
Create a Home Valuation Report for This Property
The Home Valuation Report is an in-depth analysis detailing your home's value as well as a comparison with similar homes in the area
Home Values in the Area
Average Home Value in this Area
Purchase History
| Date | Buyer | Sale Price | Title Company |
|---|---|---|---|
| Fair Janice | -- | None Available | |
| Fair Janice | -- | None Available | |
| Fair Janice M | $75,000 | Attorneys Natl Title Network |
Source: Public Records
Mortgage History
| Date | Status | Borrower | Loan Amount |
|---|---|---|---|
| Open | Fair Janice | $95,000 | |
| Previous Owner | Fair Janice M | $74,642 |
Source: Public Records
Tax History Compared to Growth
Tax History
| Year | Tax Paid | Tax Assessment Tax Assessment Total Assessment is a certain percentage of the fair market value that is determined by local assessors to be the total taxable value of land and additions on the property. | Land | Improvement |
|---|---|---|---|---|
| 2024 | $5,909 | $14,000 | $2,340 | $11,660 |
| 2023 | $2,918 | $14,000 | $2,340 | $11,660 |
| 2022 | $2,918 | $7,451 | $2,048 | $5,403 |
| 2021 | $3,043 | $7,450 | $2,047 | $5,403 |
| 2020 | $2,995 | $7,450 | $2,047 | $5,403 |
| 2019 | $4,631 | $9,835 | $1,901 | $7,934 |
| 2018 | $4,560 | $9,835 | $1,901 | $7,934 |
| 2017 | $4,435 | $9,835 | $1,901 | $7,934 |
| 2016 | $3,919 | $8,558 | $1,755 | $6,803 |
| 2015 | $3,704 | $8,558 | $1,755 | $6,803 |
| 2014 | $3,735 | $8,558 | $1,755 | $6,803 |
| 2013 | $4,194 | $10,034 | $1,755 | $8,279 |
Source: Public Records
Map
Nearby Homes