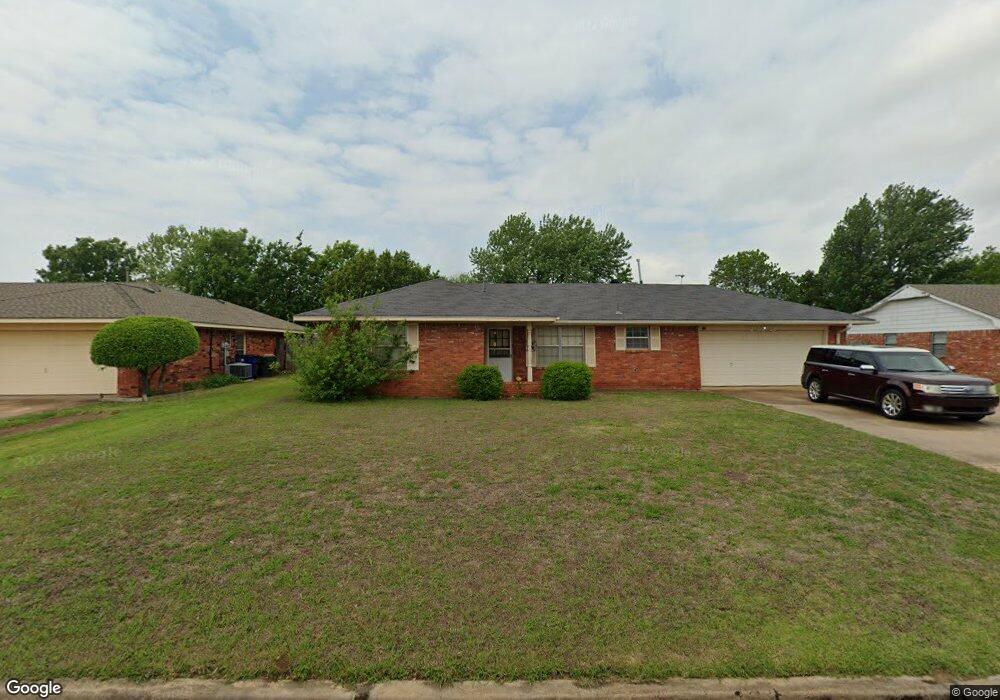
3 S 28th St Duncan, OK 73533
Estimated Value: $139,000 - $162,000
3
Beds
2
Baths
1,423
Sq Ft
$107/Sq Ft
Est. Value
About This Home
This home is located at 3 S 28th St, Duncan, OK 73533 and is currently estimated at $151,971, approximately $106 per square foot. 3 S 28th St is a home located in Stephens County with nearby schools including Mark Twain Elementary School, Duncan Middle School, and Duncan High School.
Ownership History
Date
Name
Owned For
Owner Type
Purchase Details
Closed on
Aug 15, 2024
Sold by
Wallraven Cliff R and Wallraven Kay S
Bought by
Stegmeier Steven M and Hodges Kami D
Current Estimated Value
Home Financials for this Owner
Home Financials are based on the most recent Mortgage that was taken out on this home.
Original Mortgage
$118,000
Outstanding Balance
$116,580
Interest Rate
6.95%
Mortgage Type
New Conventional
Estimated Equity
$35,391
Purchase Details
Closed on
Aug 31, 2012
Sold by
Black Shirley
Bought by
Wallraven Clif R and Wallraven Kay S
Home Financials for this Owner
Home Financials are based on the most recent Mortgage that was taken out on this home.
Original Mortgage
$72,732
Interest Rate
3.59%
Mortgage Type
New Conventional
Purchase Details
Closed on
Nov 4, 2009
Sold by
Black Betty Jo
Bought by
Black Shirley
Purchase Details
Closed on
Aug 25, 2006
Sold by
Black Shirley and Black Shirley A
Bought by
Black Shirley and Black Betty Jo
Create a Home Valuation Report for This Property
The Home Valuation Report is an in-depth analysis detailing your home's value as well as a comparison with similar homes in the area
Purchase History
| Date | Buyer | Sale Price | Title Company |
|---|---|---|---|
| Stegmeier Steven M | $147,500 | Old Republic Title | |
| Wallraven Clif R | $72,500 | Stephens Co Abstract Co | |
| Black Shirley | -- | None Available | |
| Black Shirley | -- | None Available |
Source: Public Records
Mortgage History
| Date | Status | Borrower | Loan Amount |
|---|---|---|---|
| Open | Stegmeier Steven M | $118,000 | |
| Previous Owner | Wallraven Clif R | $72,732 |
Source: Public Records
Tax History
| Year | Tax Paid | Tax Assessment Tax Assessment Total Assessment is a certain percentage of the fair market value that is determined by local assessors to be the total taxable value of land and additions on the property. | Land | Improvement |
|---|---|---|---|---|
| 2025 | $1,284 | $16,225 | $1,012 | $15,213 |
| 2024 | $908 | $10,661 | $1,012 | $9,649 |
| 2023 | $908 | $10,661 | $1,012 | $9,649 |
| 2022 | $822 | $10,154 | $1,012 | $9,142 |
| 2021 | $784 | $9,210 | $1,012 | $8,198 |
| 2020 | $800 | $9,262 | $1,012 | $8,250 |
| 2019 | $763 | $8,821 | $1,012 | $7,809 |
| 2018 | $748 | $8,401 | $1,012 | $7,389 |
| 2017 | $722 | $8,401 | $1,012 | $7,389 |
| 2016 | $697 | $8,201 | $1,012 | $7,189 |
| 2015 | $326 | $8,201 | $1,012 | $7,189 |
| 2014 | $326 | $8,176 | $990 | $7,186 |
Source: Public Records
Map
Nearby Homes
- 104 N 31st St
- 208 N 29th St
- 261 N 29th St
- 0 W Beech Ave
- 2110 W Main St
- 209 N 22nd St
- 1239 Carriage Dr
- 174831 N 2844 Rd
- 602 Fieldcrest Dr
- 1905 W Ash Ave
- 1803 W Main St
- 1803 W Birch Ave
- 1801 W Main St
- TBD S 27th St
- 1377 Drexal Place
- 2002 Redbud Ave
- 1705 W Ash Ave
- 2206 W Spruce Ave
- 903 N Harville Rd
- 123 N Highway 81
Your Personal Tour Guide
Ask me questions while you tour the home.