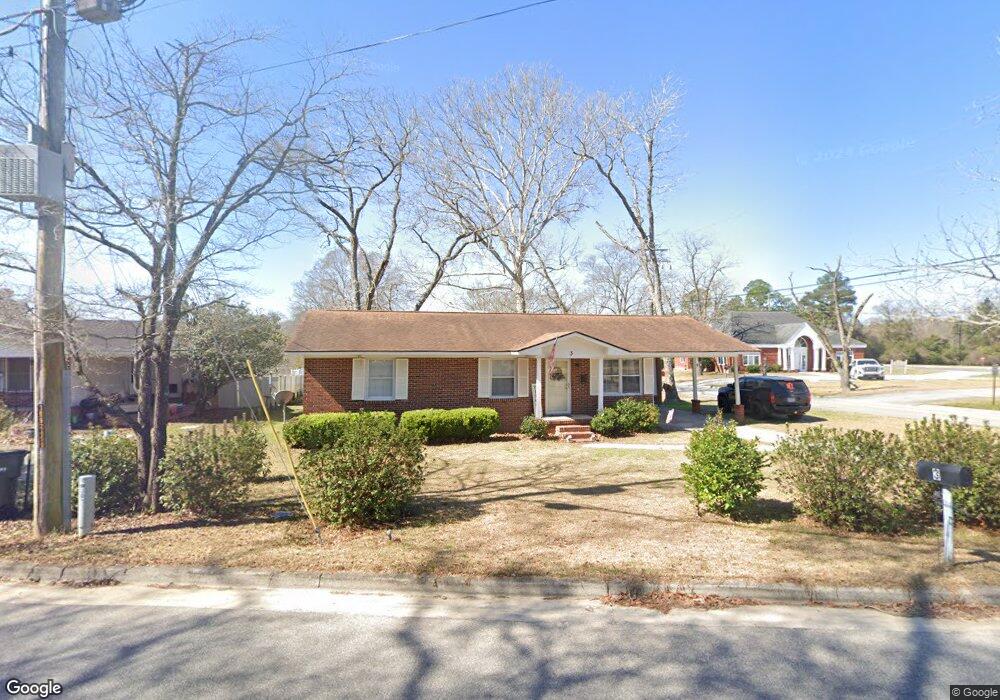
3 S College St Claxton, GA 30417
Estimated Value: $94,000 - $121,000
4
Beds
2
Baths
1,243
Sq Ft
$84/Sq Ft
Est. Value
About This Home
This home is located at 3 S College St, Claxton, GA 30417 and is currently estimated at $104,790, approximately $84 per square foot. 3 S College St is a home located in Evans County with nearby schools including Claxton Elementary School, Claxton Middle School, and Claxton High School.
Ownership History
Date
Name
Owned For
Owner Type
Purchase Details
Closed on
Apr 12, 2022
Sold by
Bozeman Robert K
Bought by
Sommers Jimmy F
Current Estimated Value
Purchase Details
Closed on
Nov 13, 2020
Sold by
Sikes James H
Bought by
Bozeman Robert K
Home Financials for this Owner
Home Financials are based on the most recent Mortgage that was taken out on this home.
Original Mortgage
$62,000
Interest Rate
2.8%
Mortgage Type
New Conventional
Purchase Details
Closed on
Dec 17, 2014
Sold by
Chapman Teresa B
Bought by
Sikes James H and Sikes Sandra W
Home Financials for this Owner
Home Financials are based on the most recent Mortgage that was taken out on this home.
Original Mortgage
$43,041
Interest Rate
4.03%
Purchase Details
Closed on
Jun 25, 2001
Sold by
Barnett Edward E
Bought by
Chapman Teresa B
Purchase Details
Closed on
Dec 8, 1992
Sold by
Barnett Edward E
Bought by
Barnett Hazel A
Create a Home Valuation Report for This Property
The Home Valuation Report is an in-depth analysis detailing your home's value as well as a comparison with similar homes in the area
Home Values in the Area
Average Home Value in this Area
Purchase History
| Date | Buyer | Sale Price | Title Company |
|---|---|---|---|
| Sommers Jimmy F | $85,000 | -- | |
| Bozeman Robert K | $73,000 | -- | |
| Sikes James H | $30,000 | -- | |
| Chapman Teresa B | -- | -- | |
| Barnett Hazel A | -- | -- |
Source: Public Records
Mortgage History
| Date | Status | Borrower | Loan Amount |
|---|---|---|---|
| Previous Owner | Bozeman Robert K | $62,000 | |
| Previous Owner | Sikes James H | $43,041 |
Source: Public Records
Tax History
| Year | Tax Paid | Tax Assessment Tax Assessment Total Assessment is a certain percentage of the fair market value that is determined by local assessors to be the total taxable value of land and additions on the property. | Land | Improvement |
|---|---|---|---|---|
| 2025 | $1,196 | $37,880 | $2,520 | $35,360 |
| 2024 | $1,033 | $42,400 | $2,520 | $39,880 |
| 2023 | $1,033 | $23,800 | $1,400 | $22,400 |
| 2022 | $862 | $23,800 | $1,400 | $22,400 |
| 2021 | $781 | $23,800 | $1,400 | $22,400 |
| 2020 | $785 | $23,840 | $1,400 | $22,440 |
| 2019 | $743 | $23,840 | $1,400 | $22,440 |
| 2018 | $733 | $23,440 | $1,400 | $22,040 |
| 2017 | $725 | $23,840 | $1,400 | $22,440 |
| 2016 | $719 | $23,400 | $1,400 | $22,000 |
| 2015 | -- | $24,080 | $1,400 | $22,680 |
| 2014 | -- | $24,080 | $1,400 | $22,680 |
| 2013 | -- | $24,440 | $1,400 | $23,040 |
Source: Public Records
Map
Nearby Homes
- 610 W Liberty St
- 606 W Liberty St
- 3 S Spring St
- 6 N Spring St
- 606 Park Ave
- 0 Dublin Rd
- 0 Turnpike Rd Unit SA339603
- 133 Mckinnon St
- 7 Honeysuckle Way
- 9 Honeysuckle Dr
- 10 Honeysuckle Dr
- 307 Mclean St
- 437 Burkhalter Cir
- 3 Honeysuckle Dr
- 12 Wisteria Ln
- 12 Wysteria Ln
- 3 Wysteria Ln
- 0 Peters St
- 12 S Duval St
- 19 Collins St
- 5 S College St
- 804 Turnpike Rd
- 4 S College St
- 6 S College St
- 9 S College St
- 716 W Main St
- 806 Turnpike Rd
- 806 W Main St
- 8 NW College St
- 8 S College St
- 11 S College St
- 710 W Main St
- 808 Turnpike Rd
- 810 W Main St
- 810 Turnpike Rd
- W W Railroad St
- 706 W Main St
- S S College St Unit 6
- S S College St Unit 12
- S S College St
Your Personal Tour Guide
Ask me questions while you tour the home.