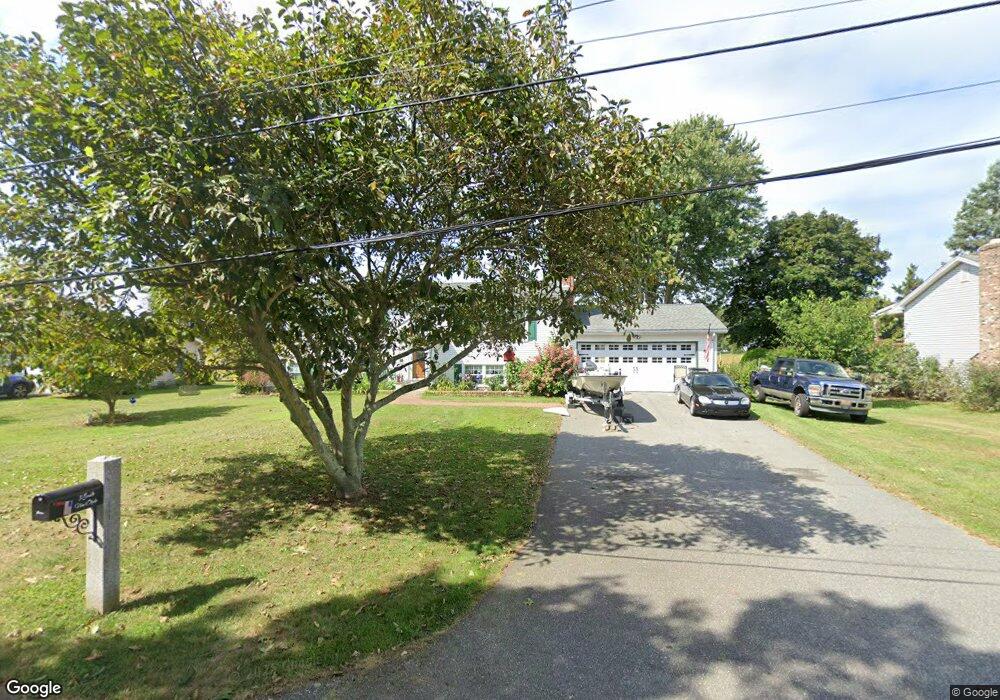
3 S View Cir Old Saybrook, CT 06475
Estimated Value: $511,000 - $656,000
3
Beds
3
Baths
1,269
Sq Ft
$474/Sq Ft
Est. Value
About This Home
This home is located at 3 S View Cir, Old Saybrook, CT 06475 and is currently estimated at $601,822, approximately $474 per square foot. 3 S View Cir is a home located in Middlesex County with nearby schools including Kathleen E. Goodwin School, Old Saybrook Middle School, and Old Saybrook Senior High School.
Ownership History
Date
Name
Owned For
Owner Type
Purchase Details
Closed on
Nov 9, 2010
Sold by
Fnma
Bought by
Swan Richard
Current Estimated Value
Purchase Details
Closed on
Aug 10, 2010
Sold by
Bratz Charles
Bought by
Citimortgage Inc
Purchase Details
Closed on
Nov 26, 1997
Sold by
Sciullo Veronica Jo
Bought by
Bratz Darlene and Bratz Charles
Purchase Details
Closed on
Mar 21, 1991
Sold by
Smythe Deborah A
Bought by
Sciullo Veronica Jo
Create a Home Valuation Report for This Property
The Home Valuation Report is an in-depth analysis detailing your home's value as well as a comparison with similar homes in the area
Home Values in the Area
Average Home Value in this Area
Purchase History
| Date | Buyer | Sale Price | Title Company |
|---|---|---|---|
| Swan Richard | $250,000 | -- | |
| Citimortgage Inc | -- | -- | |
| Bratz Darlene | $65,000 | -- | |
| Sciullo Veronica Jo | $10,000 | -- |
Source: Public Records
Mortgage History
| Date | Status | Borrower | Loan Amount |
|---|---|---|---|
| Open | Sciullo Veronica Jo | $25,001 |
Source: Public Records
Tax History Compared to Growth
Tax History
| Year | Tax Paid | Tax Assessment Tax Assessment Total Assessment is a certain percentage of the fair market value that is determined by local assessors to be the total taxable value of land and additions on the property. | Land | Improvement |
|---|---|---|---|---|
| 2025 | $5,329 | $343,800 | $135,500 | $208,300 |
| 2024 | $5,226 | $343,800 | $135,500 | $208,300 |
| 2023 | $4,943 | $241,700 | $111,100 | $130,600 |
| 2022 | $4,853 | $241,700 | $111,100 | $130,600 |
| 2021 | $4,846 | $241,700 | $111,100 | $130,600 |
| 2020 | $4,846 | $241,700 | $111,100 | $130,600 |
| 2019 | $4,774 | $241,700 | $111,100 | $130,600 |
| 2018 | $4,706 | $240,100 | $111,100 | $129,000 |
| 2017 | $4,720 | $240,100 | $111,100 | $129,000 |
| 2016 | $4,624 | $240,100 | $111,100 | $129,000 |
| 2015 | $4,452 | $236,700 | $111,100 | $125,600 |
| 2014 | $4,379 | $236,700 | $111,100 | $125,600 |
Source: Public Records
Map
Nearby Homes