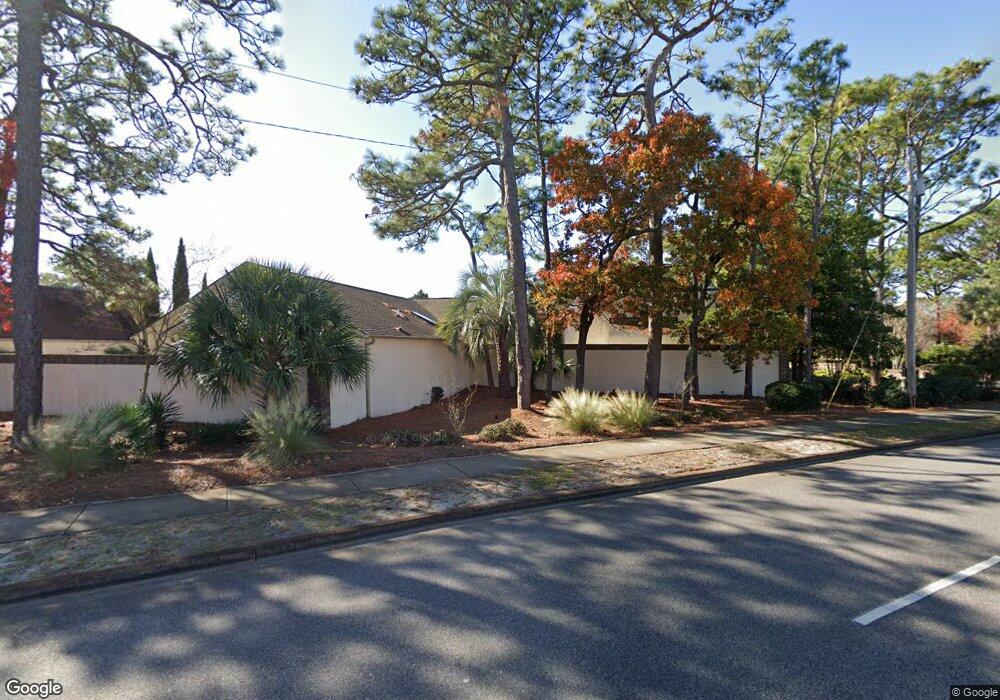
3 Sans Mark Ct Myrtle Beach, SC 29572
Grande Dunes NeighborhoodEstimated Value: $620,000
3
Beds
3
Baths
2,301
Sq Ft
$269/Sq Ft
Est. Value
About This Home
This home is located at 3 Sans Mark Ct, Myrtle Beach, SC 29572 and is currently priced at $620,000, approximately $269 per square foot. 3 Sans Mark Ct is a home located in Horry County with nearby schools including Myrtle Beach Child Development Center, Myrtle Beach Elementary School, and Myrtle Beach Primary School.
Ownership History
Date
Name
Owned For
Owner Type
Purchase Details
Closed on
Aug 4, 2025
Sold by
Leuschner Zachary
Bought by
Moore Nancy and Ficken Erick B
Current Estimated Value
Purchase Details
Closed on
Oct 8, 2021
Sold by
Leuschner Zachary
Bought by
Leuschner Zachary
Home Financials for this Owner
Home Financials are based on the most recent Mortgage that was taken out on this home.
Original Mortgage
$352,974
Interest Rate
3.05%
Mortgage Type
New Conventional
Purchase Details
Closed on
May 20, 2021
Sold by
Digney Bradley
Bought by
Leuschner Zachary and Moore Nancy
Purchase Details
Closed on
Jul 11, 2018
Sold by
Johnson Linda R
Bought by
Digney Bradley
Home Financials for this Owner
Home Financials are based on the most recent Mortgage that was taken out on this home.
Original Mortgage
$208,000
Interest Rate
4.6%
Mortgage Type
New Conventional
Purchase Details
Closed on
Jan 18, 2006
Sold by
Purdy Barbara Winstead and Purdy Douglas W
Bought by
Johnson Linda R
Create a Home Valuation Report for This Property
The Home Valuation Report is an in-depth analysis detailing your home's value as well as a comparison with similar homes in the area
Home Values in the Area
Average Home Value in this Area
Purchase History
| Date | Buyer | Sale Price | Title Company |
|---|---|---|---|
| Moore Nancy | -- | -- | |
| Leuschner Zachary | -- | -- | |
| Leuschner Zachary | $364,900 | -- | |
| Digney Bradley | $260,000 | -- | |
| Johnson Linda R | $415,900 | None Available |
Source: Public Records
Mortgage History
| Date | Status | Borrower | Loan Amount |
|---|---|---|---|
| Previous Owner | Leuschner Zachary | $352,974 | |
| Previous Owner | Digney Bradley | $208,000 |
Source: Public Records
Tax History Compared to Growth
Tax History
| Year | Tax Paid | Tax Assessment Tax Assessment Total Assessment is a certain percentage of the fair market value that is determined by local assessors to be the total taxable value of land and additions on the property. | Land | Improvement |
|---|---|---|---|---|
| 2024 | $6,798 | $31,512 | $15,000 | $16,512 |
| 2023 | $6,798 | $15,762 | $7,020 | $8,742 |
| 2021 | $6,274 | $15,762 | $7,020 | $8,742 |
| 2020 | $4,061 | $15,762 | $7,020 | $8,742 |
| 2019 | $4,061 | $15,762 | $7,020 | $8,742 |
| 2018 | $558 | $13,656 | $6,000 | $7,656 |
| 2017 | $0 | $9,104 | $4,000 | $5,104 |
| 2016 | -- | $9,104 | $4,000 | $5,104 |
| 2015 | $537 | $9,104 | $4,000 | $5,104 |
| 2014 | $484 | $9,104 | $4,000 | $5,104 |
Source: Public Records
Map
Nearby Homes
- 8057 Laurel Ash Ave
- 8053 Laurel Ash Ave Unit Lot 54
- 8079 Laurel Ash Ave Unit Lot 49
- 8091 Laurel Ash Ave Unit Lot 47
- 8111 Laurel Ash Ave Unit Lot 43
- 608 Providence Dr Unit 47
- 8 Martinique
- 8189 Buffy Ln
- 8125 Living Tide Dr Unit lot 89
- 8136 Living Tide Dr Unit Lot 68
- 650 Providence Dr
- 8035 Arcady St Unit B
- 8035 Arcady St Unit A
- 8080 Laurel Ash Ave Unit Lot 61
- 8155 Living Tide Dr
- 8163 Wood Pass Ln Unit Lot 99
- 8178 Living Tide Dr Unit Lot 77
- 756 Conifer Ct
- 8245 Sandlapper Way Unit Lot 32
- 8218 Sandlapper Way Unit Living Dunes
- 3 San Marks Ct Unit Antiqua
- 3 San Marks Ct
- 2 San Marks Ct
- 4 San Marks Ct
- 5 San Marks Ct
- 1 San Marks Ct
- 6 San Marks Ct
- 7 San Marks Ct
- 7 San Marks Ct Unit 7 San Marks Ct
- 8 San Marks Ct Unit Antigua
- 8 San Marks Ct
- 10 San Marks Ct
- 11 San Marks Ct
- 9 San Marks Ct
- 8057 Laurel Ash Ave Unit Lot 53
- 8041 Laurel Ash Ave Unit A
- 14 Valencia Cir
- 106 Sea Mark Tower Unit 311 69th Ave. N.
- 8031 Laurel Ash Ave Unit A
- 8031A Laurel Ash Ave Unit A