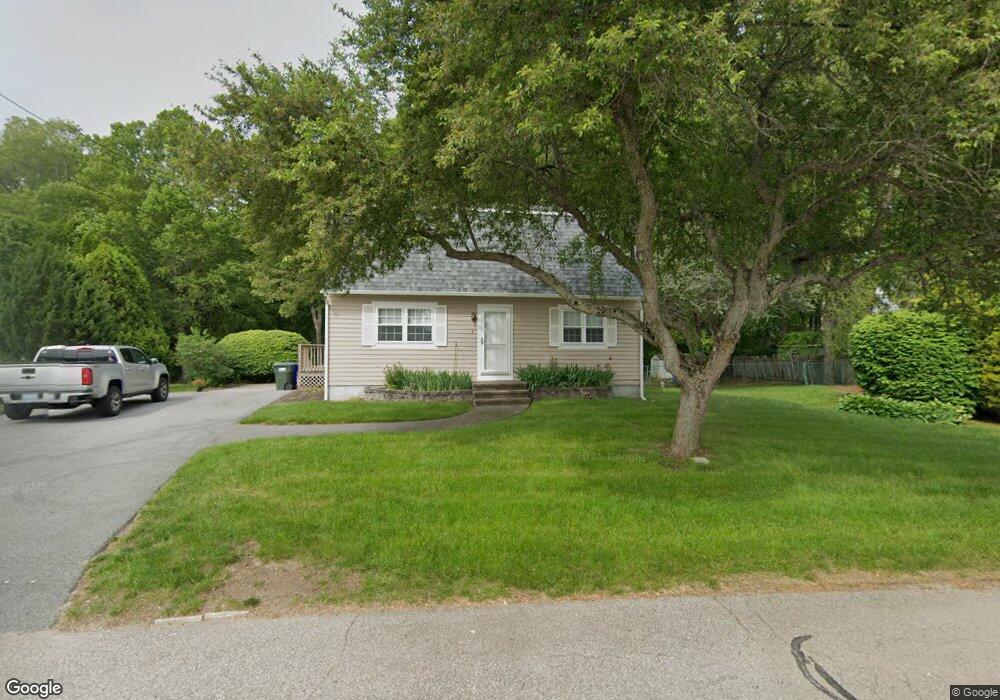
3 Saundra Dr Westerly, RI 02891
Estimated Value: $434,000 - $537,000
3
Beds
2
Baths
1,536
Sq Ft
$323/Sq Ft
Est. Value
About This Home
This home is located at 3 Saundra Dr, Westerly, RI 02891 and is currently estimated at $496,729, approximately $323 per square foot. 3 Saundra Dr is a home located in Washington County with nearby schools including Westerly High School, North Stonington Christian Academy, and St. Michael School.
Ownership History
Date
Name
Owned For
Owner Type
Purchase Details
Closed on
Apr 5, 2010
Sold by
Fleming Jennifer A
Bought by
Hublard Paul J
Current Estimated Value
Purchase Details
Closed on
Apr 12, 2006
Sold by
Lamothe Daniel R
Bought by
Fleming Jennifer A and Hublard Paul R
Home Financials for this Owner
Home Financials are based on the most recent Mortgage that was taken out on this home.
Original Mortgage
$214,400
Interest Rate
6.28%
Mortgage Type
Purchase Money Mortgage
Purchase Details
Closed on
Sep 10, 2001
Sold by
White Patricia M
Bought by
Lamothe Daniel R
Home Financials for this Owner
Home Financials are based on the most recent Mortgage that was taken out on this home.
Original Mortgage
$126,000
Interest Rate
7.05%
Create a Home Valuation Report for This Property
The Home Valuation Report is an in-depth analysis detailing your home's value as well as a comparison with similar homes in the area
Home Values in the Area
Average Home Value in this Area
Purchase History
| Date | Buyer | Sale Price | Title Company |
|---|---|---|---|
| Hublard Paul J | -- | -- | |
| Fleming Jennifer A | $268,000 | -- | |
| Lamothe Daniel R | $128,000 | -- |
Source: Public Records
Mortgage History
| Date | Status | Borrower | Loan Amount |
|---|---|---|---|
| Previous Owner | Lamothe Daniel R | $214,400 | |
| Previous Owner | Lamothe Daniel R | $53,600 | |
| Previous Owner | Lamothe Daniel R | $135,000 | |
| Previous Owner | Lamothe Daniel R | $126,000 |
Source: Public Records
Tax History
| Year | Tax Paid | Tax Assessment Tax Assessment Total Assessment is a certain percentage of the fair market value that is determined by local assessors to be the total taxable value of land and additions on the property. | Land | Improvement |
|---|---|---|---|---|
| 2025 | $3,139 | $403,500 | $158,800 | $244,700 |
| 2024 | $3,175 | $303,800 | $114,200 | $189,600 |
| 2023 | $2,987 | $294,000 | $114,200 | $179,800 |
| 2022 | $2,969 | $294,000 | $114,200 | $179,800 |
| 2021 | $3,010 | $249,600 | $99,600 | $150,000 |
| 2020 | $2,958 | $249,600 | $99,600 | $150,000 |
| 2019 | $2,930 | $249,600 | $99,600 | $150,000 |
| 2018 | $2,755 | $223,100 | $99,600 | $123,500 |
| 2017 | $2,677 | $223,100 | $99,600 | $123,500 |
| 2016 | $2,677 | $223,100 | $99,600 | $123,500 |
| 2015 | $2,597 | $231,300 | $101,600 | $129,700 |
| 2014 | $2,556 | $231,300 | $101,600 | $129,700 |
Source: Public Records
Map
Nearby Homes
Your Personal Tour Guide
Ask me questions while you tour the home.