
Seller's Agent in 2025
Stiles & Dunn
William Raveis R.E. & Home Services
(413) 336-4440
2 in this area
205 Total Sales
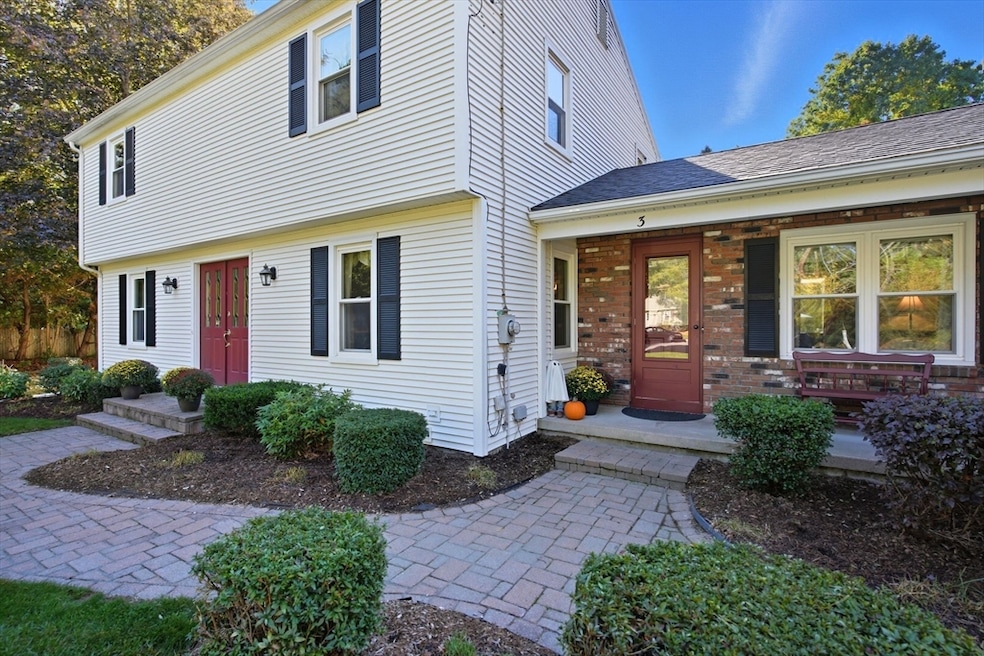
OPEN HOUSES CANCELLED. SELLERS ACCEPTED AN OFFER. Nestled on a peaceful cul-de-sac abutting the scenic Sawmill Pond Conservation Area, this well maintained 4-bedroom, 1.5-bath Colonial offers comfort, charm, and an ideal setting for everyday living and entertaining. The first floor features a seamless flow between the family room, kitchen, dining room, and living room, creating a warm and inviting atmosphere. A fabulous three-season porch extends your living space, leading to a beautifully landscaped backyard with a 20×40 in-ground pool—perfect for summer gatherings. Upstairs, you’ll find four well-proportioned bedrooms and a full bath. With many capital improvements, including a new 4 bedroom septic system (2024),Roof (2022) Bosch Gas Furnace (2023) just to name some. Set on .68 acres in one of Wilbraham’s most desirable neighborhoods, this home combines privacy, natural surroundings, and convenience in one delightful package.
Last Agent to Sell the Property
William Raveis R.E. & Home Services Listed on: 10/14/2025
| Date | Type | Sale Price | Title Company |
|---|---|---|---|
| Quit Claim Deed | $546,800 | -- | |
| Deed | -- | -- | |
| Deed | $179,100 | -- |
| Date | Status | Loan Amount | Loan Type |
|---|---|---|---|
| Open | $464,780 | New Conventional | |
| Previous Owner | $128,318 | No Value Available | |
| Previous Owner | $140,000 | Purchase Money Mortgage | |
| Previous Owner | $40,000 | No Value Available |
| Date | Event | Price | List to Sale | Price per Sq Ft |
|---|---|---|---|---|
| 11/18/2025 11/18/25 | Sold | $546,800 | +9.6% | $305 / Sq Ft |
| 10/16/2025 10/16/25 | Pending | -- | -- | -- |
| 10/14/2025 10/14/25 | For Sale | $499,000 | -- | $278 / Sq Ft |
| Year | Tax Paid | Tax Assessment Tax Assessment Total Assessment is a certain percentage of the fair market value that is determined by local assessors to be the total taxable value of land and additions on the property. | Land | Improvement |
|---|---|---|---|---|
| 2025 | $6,952 | $388,800 | $100,400 | $288,400 |
| 2024 | $7,028 | $379,900 | $100,400 | $279,500 |
| 2023 | $66 | $351,600 | $100,400 | $251,200 |
| 2022 | $6,618 | $323,000 | $100,400 | $222,600 |
| 2021 | $6,390 | $278,300 | $107,800 | $170,500 |
| 2020 | $6,228 | $278,300 | $107,800 | $170,500 |
| 2019 | $6,067 | $278,300 | $107,800 | $170,500 |
| 2018 | $6,086 | $268,800 | $107,800 | $161,000 |
| 2017 | $5,914 | $268,800 | $107,800 | $161,000 |
| 2016 | $5,646 | $261,400 | $119,300 | $142,100 |
| 2015 | $5,458 | $261,400 | $119,300 | $142,100 |
Seller's Agent in 2025
Stiles & Dunn
William Raveis R.E. & Home Services
(413) 336-4440
2 in this area
205 Total Sales
Buyer's Agent in 2025
Sara Gasparrini
RE/MAX
(413) 668-6774
14 in this area
91 Total Sales
Source: MLS Property Information Network (MLS PIN)
MLS Number: 73442702
APN: WILB-010500-000003-004272
Disclaimer: Certain information contained herein is derived from information provided by parties other than Homes.com. All information provided is deemed reliable, but is not guaranteed to be accurate and should be independently verified.
![]() The property listing data and information, or the Images, set forth herein were provided to MLS Property Information Network, Inc. from third party sources, including sellers, lessors and public records, and were compiled by MLS Property Information Network, Inc. The property listing data and information, and the Images, are for the personal, non-commercial use of consumers having a good faith interest in purchasing or leasing listed properties of the type displayed to them and may not be used for any purpose other than to identify prospective properties which such consumers may have a good faith interest in purchasing or leasing. MLS Property Information Network, Inc. and its subscribers disclaim any and all representations and warranties as to the accuracy of the property listing data and information, or as to the accuracy of any of the Images, set forth herein.
The property listing data and information, or the Images, set forth herein were provided to MLS Property Information Network, Inc. from third party sources, including sellers, lessors and public records, and were compiled by MLS Property Information Network, Inc. The property listing data and information, and the Images, are for the personal, non-commercial use of consumers having a good faith interest in purchasing or leasing listed properties of the type displayed to them and may not be used for any purpose other than to identify prospective properties which such consumers may have a good faith interest in purchasing or leasing. MLS Property Information Network, Inc. and its subscribers disclaim any and all representations and warranties as to the accuracy of the property listing data and information, or as to the accuracy of any of the Images, set forth herein.
Ask me questions while you tour the home.