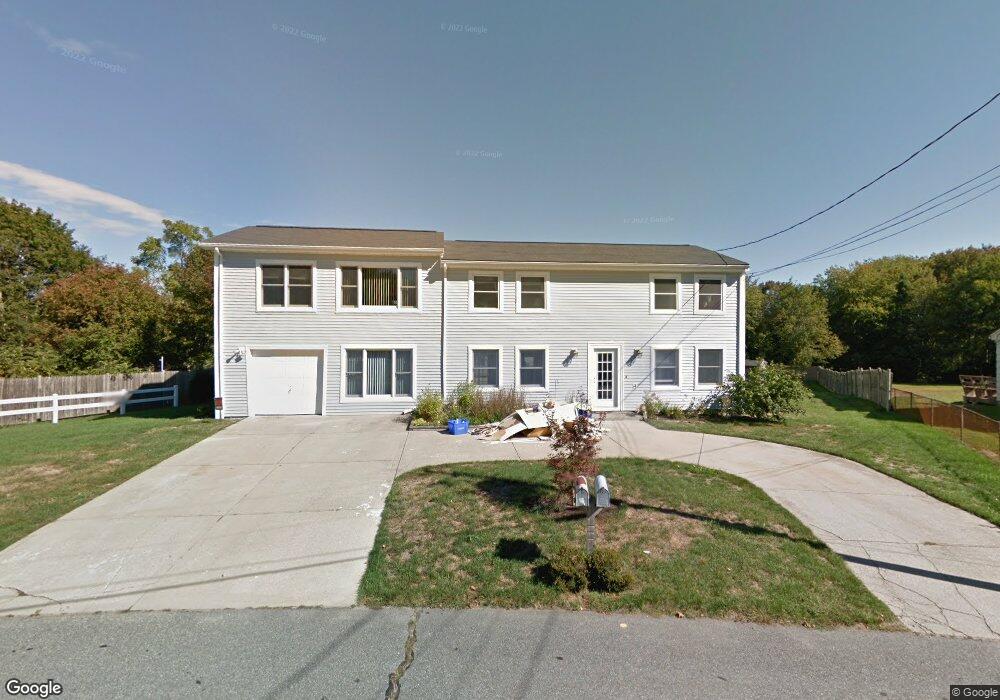
3 Schoolhouse Ln North Dartmouth, MA 02747
Estimated Value: $531,000 - $728,000
3
Beds
2
Baths
2,040
Sq Ft
$301/Sq Ft
Est. Value
About This Home
This home is located at 3 Schoolhouse Ln, North Dartmouth, MA 02747 and is currently estimated at $614,304, approximately $301 per square foot. 3 Schoolhouse Ln is a home located in Bristol County with nearby schools including Dartmouth High School, Nazarene Christian Academy, and Bishop Stang High School.
Ownership History
Date
Name
Owned For
Owner Type
Purchase Details
Closed on
Jul 2, 2022
Sold by
Reis Sergio M and Reis Maria D
Bought by
Reis Irt
Current Estimated Value
Purchase Details
Closed on
Jul 7, 2010
Sold by
Perry Ira E and Perry Lesley A
Bought by
Reis Sergio M and Reis Maria D
Home Financials for this Owner
Home Financials are based on the most recent Mortgage that was taken out on this home.
Original Mortgage
$150,000
Interest Rate
4.78%
Mortgage Type
Purchase Money Mortgage
Purchase Details
Closed on
Oct 31, 1995
Sold by
Citizens Bk Mass
Bought by
Dossantos Arlindo
Home Financials for this Owner
Home Financials are based on the most recent Mortgage that was taken out on this home.
Original Mortgage
$92,025
Interest Rate
7.6%
Mortgage Type
Purchase Money Mortgage
Purchase Details
Closed on
Jan 25, 1995
Sold by
Souza Milton F
Bought by
Citizens Bank Of Mass
Create a Home Valuation Report for This Property
The Home Valuation Report is an in-depth analysis detailing your home's value as well as a comparison with similar homes in the area
Home Values in the Area
Average Home Value in this Area
Purchase History
| Date | Buyer | Sale Price | Title Company |
|---|---|---|---|
| Reis Irt | -- | None Available | |
| Reis Sergio M | $260,000 | -- | |
| Dossantos Arlindo | $95,000 | -- | |
| Citizens Bank Of Mass | $75,600 | -- |
Source: Public Records
Mortgage History
| Date | Status | Borrower | Loan Amount |
|---|---|---|---|
| Previous Owner | Citizens Bank Of Mass | $150,000 | |
| Previous Owner | Citizens Bank Of Mass | $205,600 | |
| Previous Owner | Citizens Bank Of Mass | $92,025 | |
| Previous Owner | Citizens Bank Of Mass | $800,000 |
Source: Public Records
Tax History Compared to Growth
Tax History
| Year | Tax Paid | Tax Assessment Tax Assessment Total Assessment is a certain percentage of the fair market value that is determined by local assessors to be the total taxable value of land and additions on the property. | Land | Improvement |
|---|---|---|---|---|
| 2025 | $4,294 | $465,700 | $187,000 | $278,700 |
| 2024 | $3,828 | $413,400 | $178,300 | $235,100 |
| 2023 | $3,879 | $391,800 | $165,400 | $226,400 |
| 2022 | $3,741 | $348,000 | $158,200 | $189,800 |
| 2021 | $3,518 | $316,400 | $139,600 | $176,800 |
| 2020 | $3,568 | $319,100 | $139,600 | $179,500 |
| 2019 | $3,264 | $292,700 | $139,600 | $153,100 |
| 2018 | $3,446 | $311,500 | $139,600 | $171,900 |
| 2017 | $3,331 | $306,200 | $131,800 | $174,400 |
| 2016 | $3,297 | $299,200 | $131,800 | $167,400 |
| 2015 | $2,943 | $267,500 | $103,500 | $164,000 |
| 2014 | $2,838 | $257,100 | $100,600 | $156,500 |
Source: Public Records
Map
Nearby Homes
- 14 Westview Dr
- 10 Westview Dr
- 219 Chase Rd
- 24 Wayne Memorial Dr
- Lot 6 Rafael Rd
- 34 Country Way
- 360 Russells Mills Rd
- 75 Country Way Unit 75
- 6 Strathmore Rd
- 5 Samosett Dr
- 3 Mishawum Dr
- 312 Old Westport Rd
- 310 Old Westport Rd
- 320 Old Westport Rd
- 53 Morton Ave
- 117 Old Westport Rd
- 135 Old Westport Rd
- 1150 Russells Mills Rd
- 6 Jacob Dr
- 248 Bakerville Rd