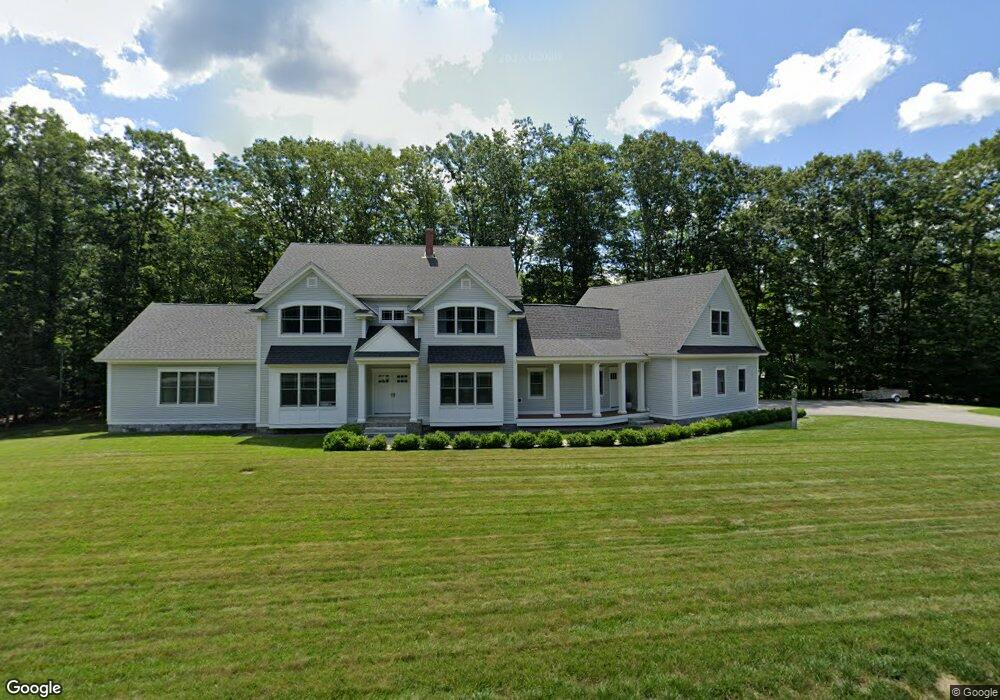
3 Scroggie Way Gorham, ME 04038
Estimated Value: $716,000 - $1,085,000
4
Beds
4
Baths
4,198
Sq Ft
$220/Sq Ft
Est. Value
About This Home
This home is located at 3 Scroggie Way, Gorham, ME 04038 and is currently estimated at $922,815, approximately $219 per square foot. 3 Scroggie Way is a home with nearby schools including Village Elementary School, Gorham Middle School, and Gorham High School.
Ownership History
Date
Name
Owned For
Owner Type
Purchase Details
Closed on
Feb 28, 2008
Sold by
Smith & Smith Constr Inc
Bought by
Wise Bradford A and Wiles Kathleen M
Current Estimated Value
Purchase Details
Closed on
Sep 12, 2006
Sold by
Smith Bradley S and Smith Margaret G
Bought by
Wise Bradford A and Wise Kathleen A
Purchase Details
Closed on
Mar 2, 2005
Sold by
Parker Michael W and Parker Carolyn D
Bought by
Smith Bradley R and Smth Margaret
Home Financials for this Owner
Home Financials are based on the most recent Mortgage that was taken out on this home.
Original Mortgage
$61,250
Interest Rate
5.66%
Mortgage Type
Purchase Money Mortgage
Create a Home Valuation Report for This Property
The Home Valuation Report is an in-depth analysis detailing your home's value as well as a comparison with similar homes in the area
Home Values in the Area
Average Home Value in this Area
Purchase History
We collect this data history from publicly available records. To have your information removed, we recommend requesting removal directly through your county’s website.
| Date | Buyer | Sale Price | Title Company |
|---|---|---|---|
| Wise Bradford A | $1,001 | -- | |
| Wise Bradford A | -- | -- | |
| Smith Bradley R | -- | -- |
Source: Public Records
Mortgage History
We collect this data history from publicly available records. To have your information removed, we recommend requesting removal directly through your county’s website.
| Date | Status | Borrower | Loan Amount |
|---|---|---|---|
| Previous Owner | Smith Bradley R | $61,250 |
Source: Public Records
Tax History
| Year | Tax Paid | Tax Assessment Tax Assessment Total Assessment is a certain percentage of the fair market value that is determined by local assessors to be the total taxable value of land and additions on the property. | Land | Improvement |
|---|---|---|---|---|
| 2025 | $12,086 | $816,600 | $97,500 | $719,100 |
| 2024 | $12,004 | $816,600 | $97,500 | $719,100 |
| 2023 | $11,228 | $816,600 | $97,500 | $719,100 |
| 2022 | $10,493 | $816,600 | $97,500 | $719,100 |
| 2021 | $9,258 | $477,200 | $77,200 | $400,000 |
| 2020 | $9,067 | $477,200 | $77,200 | $400,000 |
| 2019 | $9,043 | $477,200 | $77,200 | $400,000 |
| 2018 | $8,685 | $477,200 | $77,200 | $400,000 |
| 2017 | $8,160 | $477,200 | $77,200 | $400,000 |
| 2016 | $8,116 | $477,400 | $77,400 | $400,000 |
| 2015 | $7,782 | $477,400 | $77,400 | $400,000 |
| 2014 | $7,235 | $415,800 | $65,400 | $350,400 |
| 2013 | $7,193 | $415,800 | $65,400 | $350,400 |
Source: Public Records
Map
Nearby Homes
Your Personal Tour Guide
Ask me questions while you tour the home.