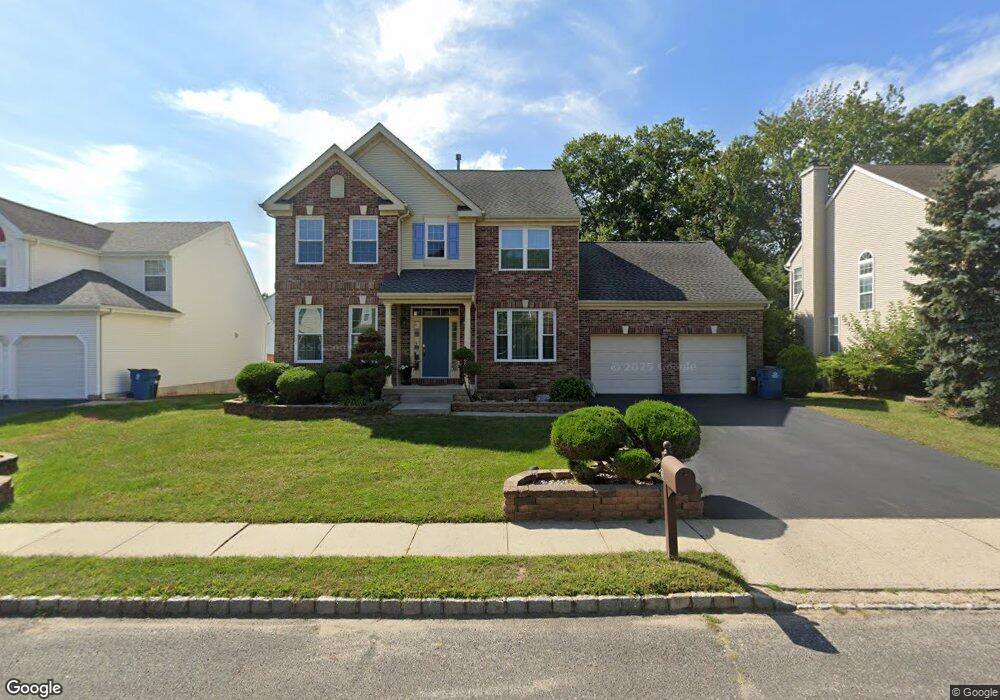
3 Shannon Ct Howell, NJ 07731
Salem Hill NeighborhoodEstimated Value: $786,780 - $919,000
4
Beds
2
Baths
2,052
Sq Ft
$406/Sq Ft
Est. Value
About This Home
This home is located at 3 Shannon Ct, Howell, NJ 07731 and is currently estimated at $833,195, approximately $406 per square foot. 3 Shannon Ct is a home located in Monmouth County with nearby schools including Land O' Pines School, Newbury School, and Howell Middle School North.
Ownership History
Date
Name
Owned For
Owner Type
Purchase Details
Closed on
Dec 23, 1996
Sold by
Calton Homes
Bought by
Jiries Ciad and Jiries Maysouna
Current Estimated Value
Home Financials for this Owner
Home Financials are based on the most recent Mortgage that was taken out on this home.
Original Mortgage
$120,000
Outstanding Balance
$11,825
Interest Rate
7.36%
Estimated Equity
$821,370
Create a Home Valuation Report for This Property
The Home Valuation Report is an in-depth analysis detailing your home's value as well as a comparison with similar homes in the area
Home Values in the Area
Average Home Value in this Area
Purchase History
| Date | Buyer | Sale Price | Title Company |
|---|---|---|---|
| Jiries Ciad | $190,000 | -- |
Source: Public Records
Mortgage History
| Date | Status | Borrower | Loan Amount |
|---|---|---|---|
| Open | Jiries Ciad | $120,000 |
Source: Public Records
Tax History
| Year | Tax Paid | Tax Assessment Tax Assessment Total Assessment is a certain percentage of the fair market value that is determined by local assessors to be the total taxable value of land and additions on the property. | Land | Improvement |
|---|---|---|---|---|
| 2025 | $11,303 | $711,700 | $384,500 | $327,200 |
| 2024 | $10,295 | $635,700 | $314,500 | $321,200 |
Source: Public Records
Map
Nearby Homes
Your Personal Tour Guide
Ask me questions while you tour the home.