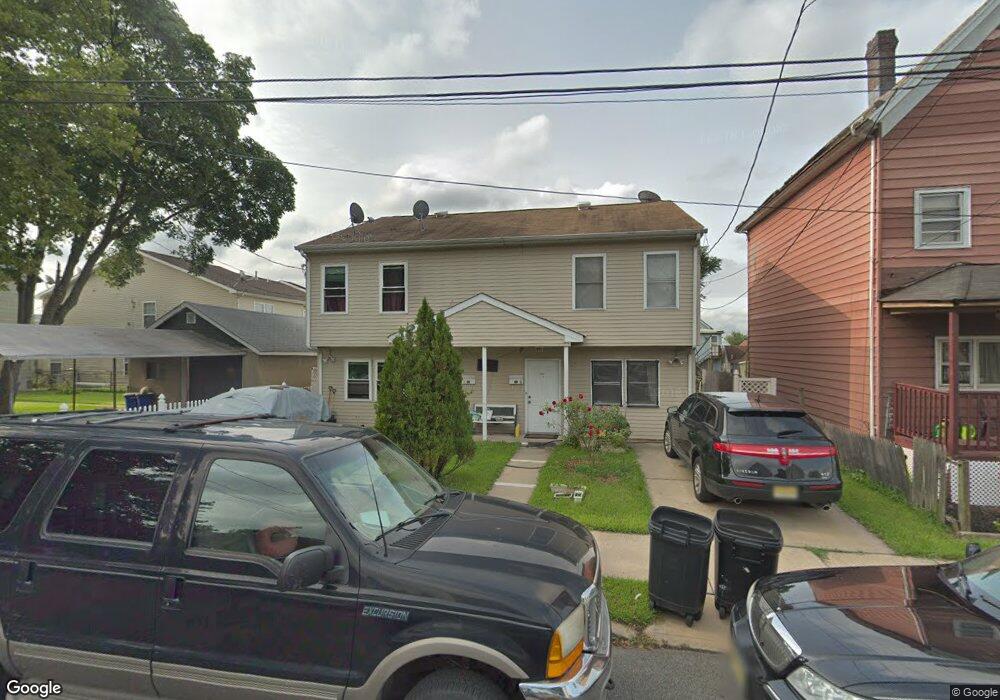
3 Sharot St Carteret, NJ 07008
Estimated Value: $370,474 - $437,000
--
Bed
--
Bath
1,224
Sq Ft
$335/Sq Ft
Est. Value
About This Home
This home is located at 3 Sharot St, Carteret, NJ 07008 and is currently estimated at $410,369, approximately $335 per square foot. 3 Sharot St is a home located in Middlesex County with nearby schools including Carteret High School and St Joseph School.
Ownership History
Date
Name
Owned For
Owner Type
Purchase Details
Closed on
May 31, 2005
Sold by
Omar Farouk
Bought by
Omar Omar
Current Estimated Value
Home Financials for this Owner
Home Financials are based on the most recent Mortgage that was taken out on this home.
Original Mortgage
$150,000
Outstanding Balance
$78,460
Interest Rate
5.79%
Mortgage Type
New Conventional
Estimated Equity
$331,909
Purchase Details
Closed on
Sep 3, 2002
Sold by
Mohamed Omar
Bought by
Omar Farouk
Home Financials for this Owner
Home Financials are based on the most recent Mortgage that was taken out on this home.
Original Mortgage
$108,800
Interest Rate
6.24%
Purchase Details
Closed on
Jul 14, 1999
Sold by
Boland David
Bought by
Mohamed Omar
Home Financials for this Owner
Home Financials are based on the most recent Mortgage that was taken out on this home.
Original Mortgage
$84,550
Interest Rate
7.5%
Create a Home Valuation Report for This Property
The Home Valuation Report is an in-depth analysis detailing your home's value as well as a comparison with similar homes in the area
Home Values in the Area
Average Home Value in this Area
Purchase History
| Date | Buyer | Sale Price | Title Company |
|---|---|---|---|
| Omar Omar | $210,000 | -- | |
| Omar Farouk | $130,000 | -- | |
| Mohamed Omar | $89,000 | -- |
Source: Public Records
Mortgage History
| Date | Status | Borrower | Loan Amount |
|---|---|---|---|
| Open | Omar Omar | $150,000 | |
| Previous Owner | Omar Farouk | $108,800 | |
| Previous Owner | Mohamed Omar | $84,550 |
Source: Public Records
Tax History Compared to Growth
Tax History
| Year | Tax Paid | Tax Assessment Tax Assessment Total Assessment is a certain percentage of the fair market value that is determined by local assessors to be the total taxable value of land and additions on the property. | Land | Improvement |
|---|---|---|---|---|
| 2025 | $4,639 | $393,200 | $266,300 | $126,900 |
| 2024 | $4,519 | $145,500 | $57,500 | $88,000 |
| 2023 | $4,519 | $145,500 | $57,500 | $88,000 |
| 2022 | $4,394 | $145,500 | $57,500 | $88,000 |
| 2021 | $4,064 | $145,500 | $57,500 | $88,000 |
| 2020 | $4,185 | $145,500 | $57,500 | $88,000 |
| 2019 | $4,064 | $145,500 | $57,500 | $88,000 |
| 2018 | $3,968 | $145,500 | $57,500 | $88,000 |
| 2017 | $3,827 | $145,500 | $57,500 | $88,000 |
| 2016 | $4,355 | $137,500 | $52,500 | $85,000 |
| 2015 | $4,291 | $137,500 | $52,500 | $85,000 |
| 2014 | $4,104 | $137,500 | $52,500 | $85,000 |
Source: Public Records
Map
Nearby Homes
- 42 Randolph St
- 6 Fitch St
- 519 Roosevelt Ave
- 4 Lefferts St
- 97 Randolph St
- 18 John St
- 613 Roosevelt Ave
- 89 Sharot St
- 23 Leick Ave
- 141 Emerson St
- 72 Charles St
- 165 Randolph St
- 56 Thornal St
- 22 N Whittier St Unit B
- 84-86 Washington Ave
- 58 Hayward Ave
- 123 Heald St
- 114 Washington Ave
- 160 Pershing Ave
- 68 Atlantic St