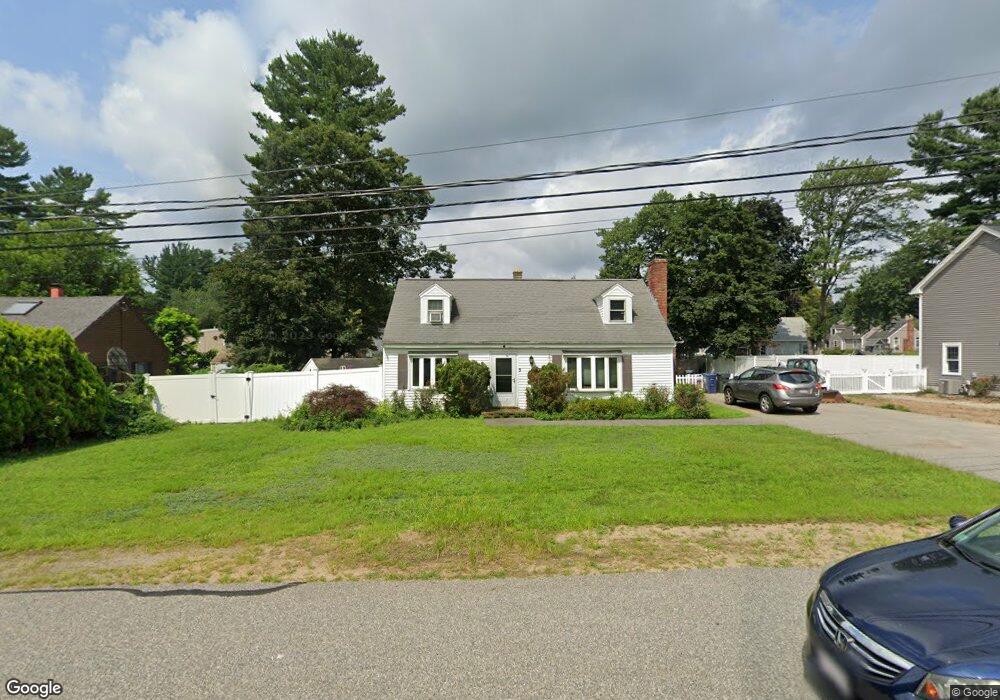
3 Sheridan Rd Wilmington, MA 01887
Estimated Value: $723,611 - $829,000
3
Beds
2
Baths
1,662
Sq Ft
$457/Sq Ft
Est. Value
About This Home
This home is located at 3 Sheridan Rd, Wilmington, MA 01887 and is currently estimated at $759,153, approximately $456 per square foot. 3 Sheridan Rd is a home located in Middlesex County with nearby schools including Wilmington Middle School, Wilmington High School, and Abundant Life Christian School and Childcare.
Ownership History
Date
Name
Owned For
Owner Type
Purchase Details
Closed on
Apr 29, 1991
Sold by
Barthelmes James T and Barthelmes Virginia
Bought by
Appleby Henry P
Current Estimated Value
Create a Home Valuation Report for This Property
The Home Valuation Report is an in-depth analysis detailing your home's value as well as a comparison with similar homes in the area
Home Values in the Area
Average Home Value in this Area
Purchase History
| Date | Buyer | Sale Price | Title Company |
|---|---|---|---|
| Appleby Henry P | $139,900 | -- |
Source: Public Records
Mortgage History
| Date | Status | Borrower | Loan Amount |
|---|---|---|---|
| Open | Appleby Henry P | $50,000 | |
| Open | Appleby Henry P | $157,000 | |
| Closed | Appleby Henry P | $27,500 | |
| Closed | Appleby Henry P | $131,000 |
Source: Public Records
Tax History Compared to Growth
Tax History
| Year | Tax Paid | Tax Assessment Tax Assessment Total Assessment is a certain percentage of the fair market value that is determined by local assessors to be the total taxable value of land and additions on the property. | Land | Improvement |
|---|---|---|---|---|
| 2025 | $7,126 | $622,400 | $327,000 | $295,400 |
| 2024 | $6,843 | $598,700 | $327,000 | $271,700 |
| 2023 | $6,508 | $545,100 | $277,400 | $267,700 |
| 2022 | $6,277 | $481,700 | $231,200 | $250,500 |
| 2021 | $6,087 | $439,800 | $210,100 | $229,700 |
| 2020 | $5,892 | $433,900 | $210,100 | $223,800 |
| 2019 | $5,873 | $427,100 | $205,500 | $221,600 |
| 2018 | $5,556 | $385,600 | $195,700 | $189,900 |
| 2017 | $5,231 | $362,000 | $186,400 | $175,600 |
| 2016 | $4,920 | $336,300 | $177,600 | $158,700 |
| 2015 | $4,702 | $327,200 | $177,600 | $149,600 |
| 2014 | $4,427 | $310,900 | $169,100 | $141,800 |
Source: Public Records
Map
Nearby Homes
- 12 Lockwood Rd
- 220 Martins Landing Unit 309
- 260 Martins Landing Unit 508
- 200 Martins Landing Unit 102
- 300 Martins Landing Unit 107
- 320 Martins Landing Unit 311
- 320 Martins Landing Unit 110
- 320 Martins Landing Unit 107
- 320 Martins Landing Unit 403
- 320 Martins Landing Unit 210
- 320 Martins Landing Unit 206
- 320 Martins Landing Unit 307
- 320 Martins Landing Unit 406
- 320 Martins Landing Unit 302
- 320 Martins Landing Unit 212
- 320 Martins Landing Unit 410
- 3 Gordon Rd
- 12 Hamlin Ln
- 12 Parkview Terrace
- 3 Adelman Rd