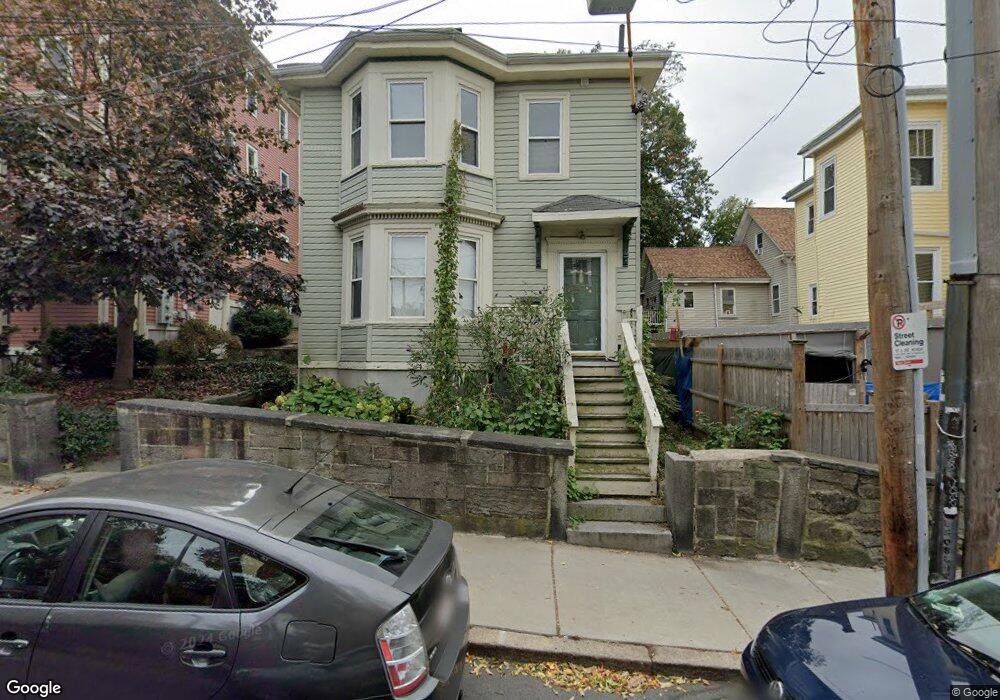
3 Sheridan St Unit 2 Jamaica Plain, MA 02130
Jamaica Plain NeighborhoodEstimated Value: $653,000 - $901,000
1
Bed
1
Bath
640
Sq Ft
$1,280/Sq Ft
Est. Value
About This Home
This home is located at 3 Sheridan St Unit 2, Jamaica Plain, MA 02130 and is currently estimated at $818,947, approximately $1,279 per square foot. 3 Sheridan St Unit 2 is a home located in Suffolk County with nearby schools including Roxbury Preparatory Charter School and Nativity Preparatory School.
Ownership History
Date
Name
Owned For
Owner Type
Purchase Details
Closed on
Mar 10, 2025
Sold by
Sheridan Street Co Llc
Bought by
Soltani Michel
Current Estimated Value
Home Financials for this Owner
Home Financials are based on the most recent Mortgage that was taken out on this home.
Original Mortgage
$637,500
Outstanding Balance
$633,200
Interest Rate
6.96%
Mortgage Type
Purchase Money Mortgage
Estimated Equity
$185,747
Purchase Details
Closed on
Oct 14, 2021
Sold by
Brennan Gerard and Brennan Marian
Bought by
Sheridan St Co Llc
Purchase Details
Closed on
Jul 18, 2007
Sold by
Sheridan Street Co Llc
Bought by
Brennan Gerard and Brennan Marian
Create a Home Valuation Report for This Property
The Home Valuation Report is an in-depth analysis detailing your home's value as well as a comparison with similar homes in the area
Home Values in the Area
Average Home Value in this Area
Purchase History
| Date | Buyer | Sale Price | Title Company |
|---|---|---|---|
| Soltani Michel | $850,000 | None Available | |
| Soltani Michel | $850,000 | None Available | |
| Sheridan St Co Llc | -- | None Available | |
| Sheridan St Co Llc | -- | None Available | |
| Brennan Gerard | -- | -- | |
| Brennan Gerard | -- | -- |
Source: Public Records
Mortgage History
| Date | Status | Borrower | Loan Amount |
|---|---|---|---|
| Open | Soltani Michel | $637,500 | |
| Closed | Soltani Michel | $637,500 |
Source: Public Records
Tax History Compared to Growth
Tax History
| Year | Tax Paid | Tax Assessment Tax Assessment Total Assessment is a certain percentage of the fair market value that is determined by local assessors to be the total taxable value of land and additions on the property. | Land | Improvement |
|---|---|---|---|---|
| 2025 | $5,477 | $473,000 | $0 | $473,000 |
| 2024 | $5,249 | $481,600 | $0 | $481,600 |
| 2023 | $4,924 | $458,500 | $0 | $458,500 |
| 2022 | $4,706 | $432,500 | $0 | $432,500 |
| 2021 | $4,395 | $411,900 | $0 | $411,900 |
| 2020 | $4,017 | $380,400 | $0 | $380,400 |
| 2019 | $3,854 | $365,700 | $0 | $365,700 |
| 2018 | $3,720 | $355,000 | $0 | $355,000 |
| 2017 | $3,548 | $335,000 | $0 | $335,000 |
| 2016 | $3,444 | $313,100 | $0 | $313,100 |
| 2015 | $3,307 | $273,100 | $0 | $273,100 |
| 2014 | $3,239 | $257,500 | $0 | $257,500 |
Source: Public Records
Map
Nearby Homes
- 32 Forbes St
- 10 Bynner St
- 70 Day St Unit 2
- 70 Day St
- 70 Day St Unit 1
- 24 Evergreen St Unit 2
- 3 Kenney St Unit 2
- 11 Gay Head St
- 343 S Huntington Ave Unit 7
- 12 Zamora St
- 71 Mozart St Unit 3
- 68 Perkins St Unit 1
- 90 Bynner St Unit 7
- 130 Minden St
- 43 Boylston St
- 65-67 Halifax St
- 23 Burr St
- 11 Spring Park Ave Unit B
- 90 Boylston St Unit 1
- 111 Perkins St Unit 108
- 3 Sheridan St
- 3 Sheridan St Unit 1
- 5 Sheridan St Unit 5
- 3 Sheridan St Unit 3
- 5 Sheridan St Unit 1
- 5 Sheridan St Unit 2
- 378 Centre St Unit 380
- 382 Centre St
- 9 Sheridan St Unit 1
- 9 Sheridan St
- 9 Sheridan St Unit 2
- 9 Sheridan St Unit 3
- 7 Sheridan St Unit 1
- 3 Cranston St
- 3 Cranston St Unit A
- 3 Cranston St Unit 3
- 376 Centre St
- 374 Centre St Unit 3
- 376 Centre St Unit 2
- 374 Centre St Unit 2