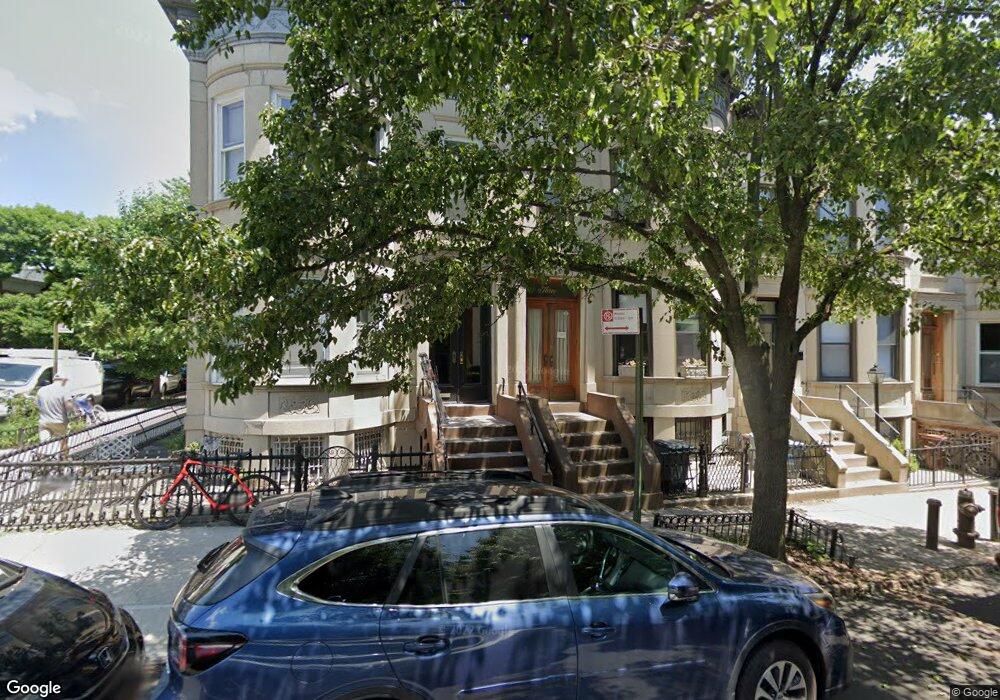
3 Sherman St Unit 1 Brooklyn, NY 11215
Windsor Terrace NeighborhoodEstimated Value: $2,436,958 - $3,108,000
1
Bed
1
Bath
2,056
Sq Ft
$1,375/Sq Ft
Est. Value
About This Home
This home is located at 3 Sherman St Unit 1, Brooklyn, NY 11215 and is currently estimated at $2,826,740, approximately $1,374 per square foot. 3 Sherman St Unit 1 is a home located in Kings County with nearby schools including P.S. 154 The Windsor Terrace School, Brooklyn Urban Garden Charter School, and St. Joseph the Worker Catholic Academy.
Ownership History
Date
Name
Owned For
Owner Type
Purchase Details
Closed on
Aug 7, 2007
Sold by
Barbiere Deborah and Deporto Robert
Bought by
Brody-Katsanos Shawn and Katsanos Andrew
Current Estimated Value
Home Financials for this Owner
Home Financials are based on the most recent Mortgage that was taken out on this home.
Original Mortgage
$330,945
Outstanding Balance
$209,857
Interest Rate
6.78%
Mortgage Type
Purchase Money Mortgage
Estimated Equity
$2,616,883
Purchase Details
Closed on
Jul 26, 2001
Sold by
Monaghan Hillary Walsh and Monaghan Kevin J
Bought by
Barbiere Deborah and Deporto Robert
Home Financials for this Owner
Home Financials are based on the most recent Mortgage that was taken out on this home.
Original Mortgage
$525,000
Interest Rate
7.21%
Mortgage Type
Purchase Money Mortgage
Create a Home Valuation Report for This Property
The Home Valuation Report is an in-depth analysis detailing your home's value as well as a comparison with similar homes in the area
Home Values in the Area
Average Home Value in this Area
Purchase History
| Date | Buyer | Sale Price | Title Company |
|---|---|---|---|
| Brody-Katsanos Shawn | $1,450,000 | -- | |
| Brody-Katsanos Shawn | $1,450,000 | -- | |
| Barbiere Deborah | -- | -- | |
| Barbiere Deborah | -- | -- |
Source: Public Records
Mortgage History
| Date | Status | Borrower | Loan Amount |
|---|---|---|---|
| Open | Brody-Katsanos Shawn | $330,945 | |
| Closed | Brody-Katsanos Shawn | $330,945 | |
| Previous Owner | Barbiere Deborah | $525,000 |
Source: Public Records
Tax History Compared to Growth
Tax History
| Year | Tax Paid | Tax Assessment Tax Assessment Total Assessment is a certain percentage of the fair market value that is determined by local assessors to be the total taxable value of land and additions on the property. | Land | Improvement |
|---|---|---|---|---|
| 2025 | $8,204 | $135,420 | $33,780 | $101,640 |
| 2024 | $8,204 | $154,260 | $33,780 | $120,480 |
| 2023 | $7,859 | $167,040 | $33,780 | $133,260 |
| 2022 | $7,296 | $137,400 | $33,780 | $103,620 |
| 2021 | $7,593 | $131,880 | $33,780 | $98,100 |
| 2020 | $3,773 | $128,220 | $33,780 | $94,440 |
| 2019 | $7,120 | $124,980 | $33,780 | $91,200 |
| 2018 | $6,573 | $32,246 | $8,222 | $24,024 |
| 2017 | $5,909 | $30,456 | $8,565 | $21,891 |
| 2016 | $5,701 | $30,067 | $9,505 | $20,562 |
| 2015 | $3,246 | $30,057 | $14,242 | $15,815 |
| 2014 | $3,246 | $28,365 | $15,716 | $12,649 |
Source: Public Records
Map
Nearby Homes
- 1663 10th Ave
- 1610 10th Ave
- 41 Prospect Park SW Unit 1C
- 601 17th St
- 506 Prospect Ave
- 552 17th St
- 515A 17th St
- 505 17th St
- 537 18th St
- 475 16th St
- 1515 11th Ave
- 273 Prospect Park W Unit 2
- 1711 11th Ave
- 87 Sherman St
- 1115 Prospect Ave Unit 4 G
- 1139 Prospect Ave Unit 3B
- 1139 Prospect Ave Unit 1L
- 475 17th St Unit 7
- 113 Prospect Park SW Unit 12
- 114 Terrace Place
- 3 Sherman St
- 5 Sherman St
- 7 Sherman St
- 1637 10th Ave
- 9 Sherman St
- 1635 10th Ave
- 1633 10th Ave
- 11A Sherman St
- 11 Sherman St
- 11 Sherman St Unit 2
- 11 Sherman St Unit 1
- 1629 10th Ave
- 15 Sherman St
- 1627 10th Ave
- 192 Windsor Place
- 4 Sherman St
- 4 Sherman St Unit 3
- 4 Sherman St Unit 2
- 194 Windsor Place
- 17 Sherman St