Estimated Value: $280,400 - $402,000
--
Bed
2
Baths
2,046
Sq Ft
$171/Sq Ft
Est. Value
About This Home
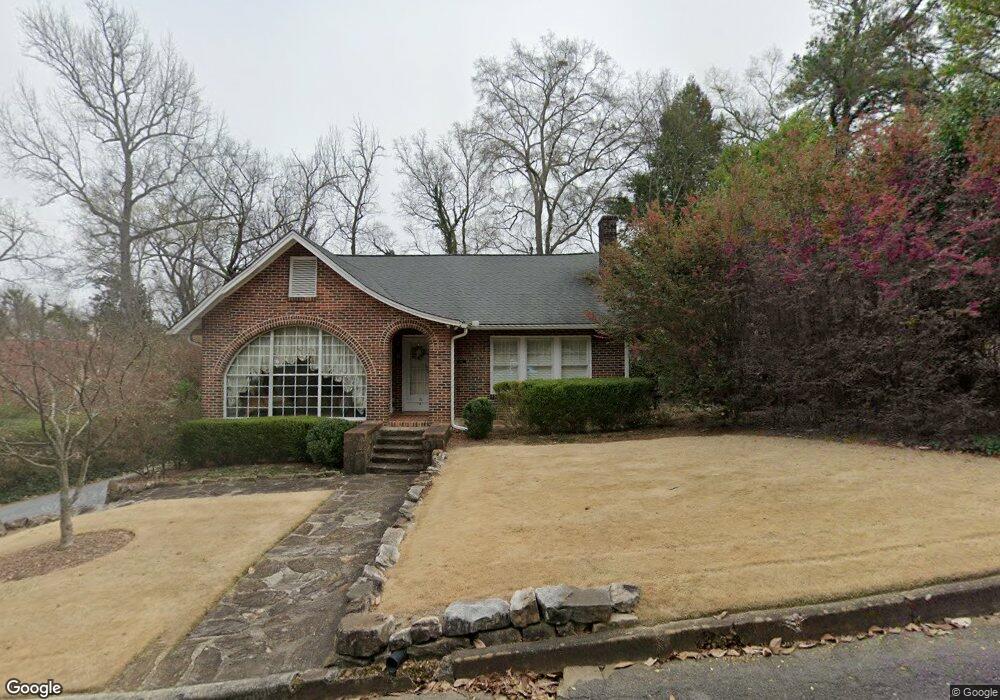
This home is located at 3 Shorter Cir SW, Rome, GA 30165 and is currently estimated at $350,600, approximately $171 per square foot. 3 Shorter Cir SW is a home located in Floyd County with nearby schools including Rome High School, St. Mary School, and Darlington School.
Ownership History
Date
Name
Owned For
Owner Type
Purchase Details
Closed on
Jun 25, 2004
Sold by
Barbogello Maureen
Bought by
Gillespie John E and Rebecca Gilles L
Current Estimated Value
Purchase Details
Closed on
Aug 11, 2003
Sold by
Barbogello Maureen B
Bought by
Barbogello Maureen
Purchase Details
Closed on
Sep 20, 2001
Sold by
Barbogello Maureen B
Bought by
Barbogello Maureen B
Purchase Details
Closed on
Oct 15, 1996
Sold by
Watts Susan Brown
Bought by
Barbogello Maureen B
Purchase Details
Closed on
Jan 21, 1994
Sold by
Bishop John Eugene and Bishop Cynthia S
Bought by
Watts Susan Brown
Purchase Details
Closed on
May 15, 1992
Sold by
Hill Max Eugene
Bought by
Bishop John Eugene and Bish Cynthia S
Purchase Details
Closed on
Aug 24, 1988
Sold by
Cade Claremce and Cade Juanell
Bought by
Hill Max Eugene
Purchase Details
Closed on
Nov 16, 1981
Sold by
Oglesby J B
Bought by
Cade Claremce and Cade Juanell
Purchase Details
Closed on
Jan 1, 1901
Bought by
Oglesby J B
Create a Home Valuation Report for This Property
The Home Valuation Report is an in-depth analysis detailing your home's value as well as a comparison with similar homes in the area
Home Values in the Area
Average Home Value in this Area
Purchase History
| Date | Buyer | Sale Price | Title Company |
|---|---|---|---|
| Gillespie John E | $200,000 | -- | |
| Barbogello Maureen | -- | -- | |
| Barbogello Maureen B | -- | -- | |
| Barbogello Maureen B | $130,000 | -- | |
| Watts Susan Brown | $114,000 | -- | |
| Bishop John Eugene | $90,000 | -- | |
| Hill Max Eugene | $68,000 | -- | |
| Cade Claremce | $45,000 | -- | |
| Oglesby J B | -- | -- |
Source: Public Records
Tax History Compared to Growth
Tax History
| Year | Tax Paid | Tax Assessment Tax Assessment Total Assessment is a certain percentage of the fair market value that is determined by local assessors to be the total taxable value of land and additions on the property. | Land | Improvement |
|---|---|---|---|---|
| 2024 | $3,374 | $111,411 | $15,192 | $96,219 |
| 2023 | $3,348 | $119,603 | $13,811 | $105,792 |
| 2022 | $3,230 | $98,694 | $11,394 | $87,300 |
| 2021 | $3,121 | $89,472 | $11,394 | $78,078 |
| 2020 | $3,266 | $96,384 | $8,632 | $87,752 |
| 2019 | $3,167 | $92,466 | $8,632 | $83,834 |
| 2018 | $3,095 | $88,332 | $8,632 | $79,700 |
| 2017 | $3,013 | $83,573 | $8,632 | $74,941 |
| 2016 | $3,005 | $82,640 | $8,600 | $74,040 |
| 2015 | $2,825 | $81,825 | $8,600 | $73,225 |
| 2014 | $2,825 | $81,825 | $8,600 | $73,225 |
Source: Public Records
Map
Nearby Homes
- 9 Shorter Cir SW
- 209 Sherwood Rd SW
- 17 Rosewood Rd SW
- 6 Horseleg Creek Rd SW
- 0 Unbridled Rd Unit 22 23074684
- 19 Berckman Ln SW
- 3 Berckman Ln SW
- 14 Berckman Ln SW
- 1005 N 2nd Ave NW Unit 39
- PEARSON Plan at Shorter Village
- 13 Ridgewood Rd SW
- 0 Mount Alto Rd SW Unit 10523740
- 8 S Hughes St SW
- 204 Oakwood St NW
- 7 Raymond Ave NW
- 14 Vineland Dr NW
- 124 Sheridan Dr NW
- 614 Briarwood Cir NW
- 4 Colonial Dr NW
- 16 Wilkerson Rd SW
- 1 Shorter Cir SW
- 5 Shorter Cir SW
- 0 Shorter Cir SW Unit 8593261
- 0 Shorter Cir SW Unit 7081874
- 0 Shorter Cir SW Unit 3169077
- 0 Shorter Cir SW
- 2 Sherwood Rd SW
- 403 Shorter Ave SW
- 4 Sherwood Rd SW
- 7 Shorter Cir SW
- 6 Sherwood Rd SW
- 402 Shorter Ave NW
- 13 Shorter Cir SW
- 13 Shorter Cir SW Unit 3
- 91 Shorter Cir SW Unit 2
- 11 Shorter Cir SW
- 15 Shorter Cir SW
- 10 Sherwood Rd SW
- 404 Shorter Ave NW
- 406 Shorter Ave NW