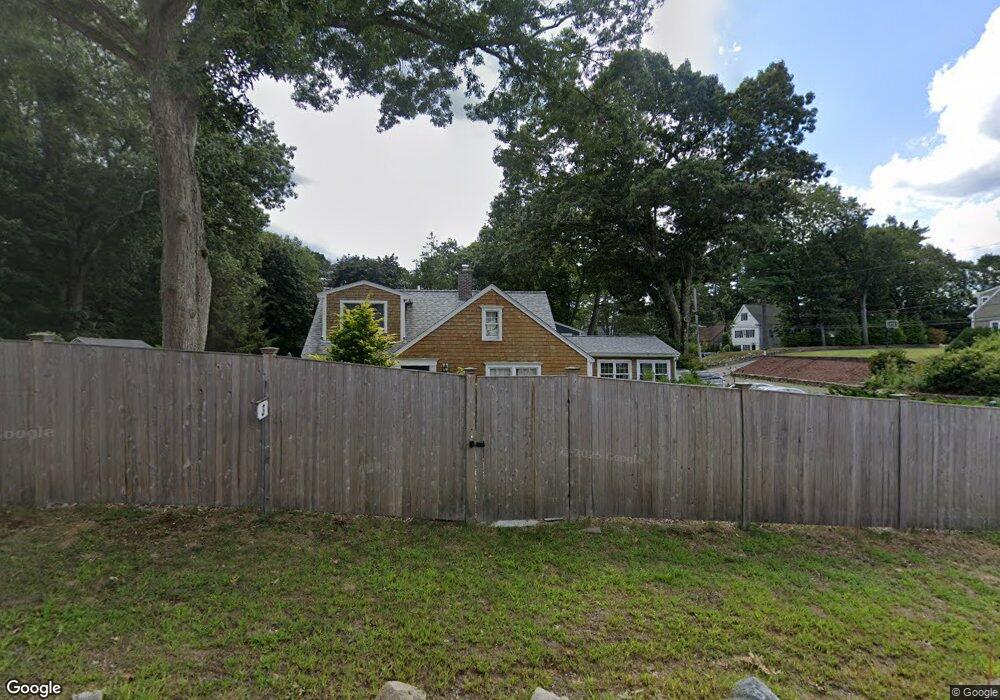
3 Smith Way Hingham, MA 02043
Estimated Value: $1,037,394 - $1,330,000
4
Beds
3
Baths
2,049
Sq Ft
$571/Sq Ft
Est. Value
About This Home
This home is located at 3 Smith Way, Hingham, MA 02043 and is currently estimated at $1,169,849, approximately $570 per square foot. 3 Smith Way is a home located in Plymouth County with nearby schools including Plymouth River Elementary School, Hingham Middle School, and Hingham High School.
Ownership History
Date
Name
Owned For
Owner Type
Purchase Details
Closed on
Jun 18, 2020
Sold by
Hutchinson Donald and Hutchinson Brenda
Bought by
Gragg Ft
Current Estimated Value
Purchase Details
Closed on
Oct 26, 2000
Sold by
Bednarek Brian J and Bednarek Jennifer T
Bought by
Hough John R and Hough Mariel Keane
Purchase Details
Closed on
Apr 3, 2000
Sold by
Cannata Josephine D and Cannata Edward N
Bought by
Bednarek Brian J and Bednarek Jennifer T
Create a Home Valuation Report for This Property
The Home Valuation Report is an in-depth analysis detailing your home's value as well as a comparison with similar homes in the area
Purchase History
| Date | Buyer | Sale Price | Title Company |
|---|---|---|---|
| Gragg Ft | -- | None Available | |
| Hough John R | $360,000 | -- | |
| Bednarek Brian J | $268,700 | -- |
Source: Public Records
Mortgage History
| Date | Status | Borrower | Loan Amount |
|---|---|---|---|
| Previous Owner | Bednarek Brian J | $246,000 | |
| Previous Owner | Bednarek Brian J | $285,000 | |
| Previous Owner | Bednarek Brian J | $284,000 |
Source: Public Records
Tax History
| Year | Tax Paid | Tax Assessment Tax Assessment Total Assessment is a certain percentage of the fair market value that is determined by local assessors to be the total taxable value of land and additions on the property. | Land | Improvement |
|---|---|---|---|---|
| 2025 | $9,450 | $884,000 | $437,700 | $446,300 |
| 2024 | $9,063 | $835,300 | $437,700 | $397,600 |
| 2023 | $7,733 | $773,300 | $437,700 | $335,600 |
| 2022 | $7,112 | $615,200 | $337,800 | $277,400 |
| 2021 | $6,811 | $577,200 | $337,800 | $239,400 |
| 2020 | $6,655 | $577,200 | $337,800 | $239,400 |
| 2019 | $6,568 | $556,100 | $337,800 | $218,300 |
| 2018 | $5,541 | $551,900 | $337,800 | $214,100 |
| 2017 | $6,556 | $535,200 | $333,800 | $201,400 |
| 2016 | $6,626 | $530,500 | $317,900 | $212,600 |
| 2015 | $6,458 | $515,400 | $302,800 | $212,600 |
Source: Public Records
Map
Nearby Homes
Your Personal Tour Guide
Ask me questions while you tour the home.