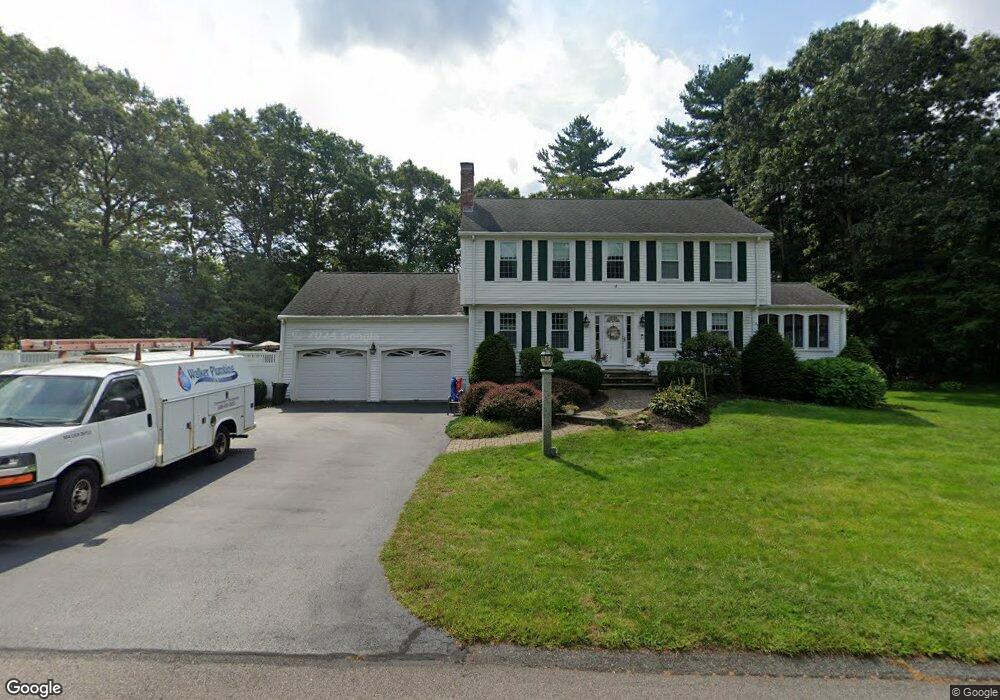
3 Stallbrook Rd Medway, MA 02053
Estimated Value: $732,604 - $861,000
3
Beds
3
Baths
2,024
Sq Ft
$389/Sq Ft
Est. Value
About This Home
This home is located at 3 Stallbrook Rd, Medway, MA 02053 and is currently estimated at $787,901, approximately $389 per square foot. 3 Stallbrook Rd is a home located in Norfolk County with nearby schools including John D. McGovern Elementary School, Burke-Memorial Elementary, and Medway Middle School.
Ownership History
Date
Name
Owned For
Owner Type
Purchase Details
Closed on
Sep 20, 2019
Sold by
Malloy Edward F and Malloy Donna C
Bought by
Walker Gregory J and Walker Kristen
Current Estimated Value
Home Financials for this Owner
Home Financials are based on the most recent Mortgage that was taken out on this home.
Original Mortgage
$389,000
Outstanding Balance
$339,239
Interest Rate
3.6%
Mortgage Type
New Conventional
Estimated Equity
$448,662
Create a Home Valuation Report for This Property
The Home Valuation Report is an in-depth analysis detailing your home's value as well as a comparison with similar homes in the area
Home Values in the Area
Average Home Value in this Area
Purchase History
| Date | Buyer | Sale Price | Title Company |
|---|---|---|---|
| Walker Gregory J | $564,000 | -- |
Source: Public Records
Mortgage History
| Date | Status | Borrower | Loan Amount |
|---|---|---|---|
| Open | Walker Gregory J | $389,000 |
Source: Public Records
Tax History
| Year | Tax Paid | Tax Assessment Tax Assessment Total Assessment is a certain percentage of the fair market value that is determined by local assessors to be the total taxable value of land and additions on the property. | Land | Improvement |
|---|---|---|---|---|
| 2025 | $9,855 | $691,600 | $326,900 | $364,700 |
| 2024 | $9,959 | $691,600 | $326,900 | $364,700 |
| 2023 | $9,896 | $620,800 | $297,500 | $323,300 |
| 2022 | $9,085 | $536,600 | $220,000 | $316,600 |
| 2021 | $9,086 | $520,400 | $205,300 | $315,100 |
| 2020 | $8,274 | $472,800 | $205,300 | $267,500 |
| 2019 | $7,816 | $460,600 | $197,000 | $263,600 |
| 2018 | $7,885 | $446,500 | $188,600 | $257,900 |
| 2017 | $7,856 | $438,400 | $184,400 | $254,000 |
| 2016 | $7,574 | $418,200 | $169,700 | $248,500 |
| 2015 | $7,657 | $419,800 | $167,600 | $252,200 |
| 2014 | $7,623 | $404,600 | $167,600 | $237,000 |
Source: Public Records
Map
Nearby Homes
- 22 Granite St
- 15 Fox Run Rd
- 39 West St
- 462 Hartford Ave
- 78 Fisher St
- 44 Arapahoe Rd
- 23 Clark St
- 6 Kingson Ln Unit 2
- 6 Freedom Trail
- 46 Black Bear Cir Unit 46
- 48 Black Bear Cir Unit 48
- 15 Black Bear Cir Unit 15
- 43 Black Bear Cir Unit 43
- 13 Black Bear Cir Unit 13
- 11 Black Bear Unit 11
- 9 Black Bear Cir Unit 9
- 7 Black Bear Unit 7
- 10 Black Bear Unit 10
- 8 Black Bear Cir Unit 8
- 17 Pine St