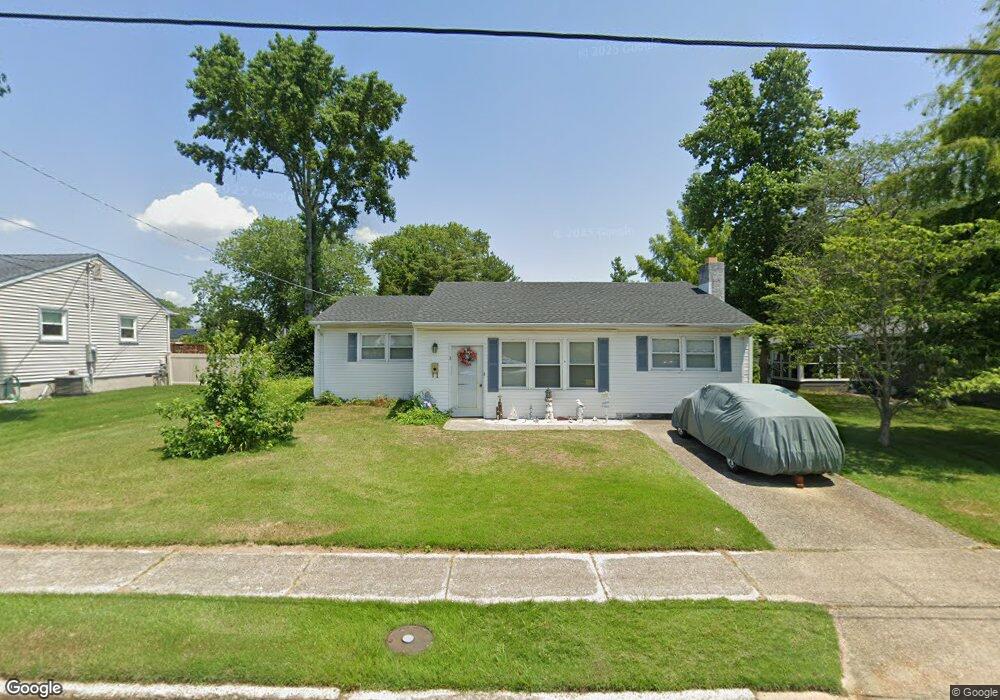
3 Stanford Rd Somers Point, NJ 08244
Estimated Value: $352,000 - $455,000
2
Beds
2
Baths
1,226
Sq Ft
$326/Sq Ft
Est. Value
About This Home
This home is located at 3 Stanford Rd, Somers Point, NJ 08244 and is currently estimated at $399,104, approximately $325 per square foot. 3 Stanford Rd is a home located in Atlantic County with nearby schools including Mainland Regional High School, ChARTer TECH High School for the Performing Arts, and Saint Joseph Regional School.
Ownership History
Date
Name
Owned For
Owner Type
Purchase Details
Closed on
Apr 2, 2015
Sold by
Lapierre Leroy R
Bought by
Lapierre Leroy R and Lapierre Linda Marie
Current Estimated Value
Purchase Details
Closed on
Apr 11, 2012
Sold by
Rice David L and Rice Shirley A
Bought by
Lapierre Leroy R
Home Financials for this Owner
Home Financials are based on the most recent Mortgage that was taken out on this home.
Original Mortgage
$63,000
Outstanding Balance
$43,474
Interest Rate
3.89%
Mortgage Type
New Conventional
Estimated Equity
$355,630
Purchase Details
Closed on
Jan 29, 1999
Sold by
Goldberg Brian and Goldberg Monica
Bought by
Rice David L and Rice Shirley A
Home Financials for this Owner
Home Financials are based on the most recent Mortgage that was taken out on this home.
Original Mortgage
$109,150
Interest Rate
6.74%
Create a Home Valuation Report for This Property
The Home Valuation Report is an in-depth analysis detailing your home's value as well as a comparison with similar homes in the area
Home Values in the Area
Average Home Value in this Area
Purchase History
| Date | Buyer | Sale Price | Title Company |
|---|---|---|---|
| Lapierre Leroy R | -- | None Available | |
| Lapierre Leroy R | $175,000 | First American Title Ins Co | |
| Rice David L | $114,900 | Citizens Title Ins Agency In |
Source: Public Records
Mortgage History
| Date | Status | Borrower | Loan Amount |
|---|---|---|---|
| Open | Lapierre Leroy R | $63,000 | |
| Previous Owner | Rice David L | $109,150 |
Source: Public Records
Tax History Compared to Growth
Tax History
| Year | Tax Paid | Tax Assessment Tax Assessment Total Assessment is a certain percentage of the fair market value that is determined by local assessors to be the total taxable value of land and additions on the property. | Land | Improvement |
|---|---|---|---|---|
| 2025 | $7,013 | $196,100 | $68,200 | $127,900 |
| 2024 | $7,013 | $196,100 | $68,200 | $127,900 |
| 2023 | $6,552 | $196,100 | $68,200 | $127,900 |
| 2022 | $6,552 | $196,100 | $68,200 | $127,900 |
| 2021 | $6,454 | $196,100 | $68,200 | $127,900 |
| 2020 | $6,322 | $196,100 | $68,200 | $127,900 |
| 2019 | $6,144 | $196,100 | $68,200 | $127,900 |
| 2018 | $6,103 | $199,000 | $68,200 | $130,800 |
| 2017 | $5,884 | $199,000 | $68,200 | $130,800 |
| 2016 | $5,618 | $199,000 | $68,200 | $130,800 |
| 2015 | $5,560 | $199,000 | $68,200 | $130,800 |
| 2014 | $5,373 | $199,000 | $68,200 | $130,800 |
Source: Public Records
Map
Nearby Homes