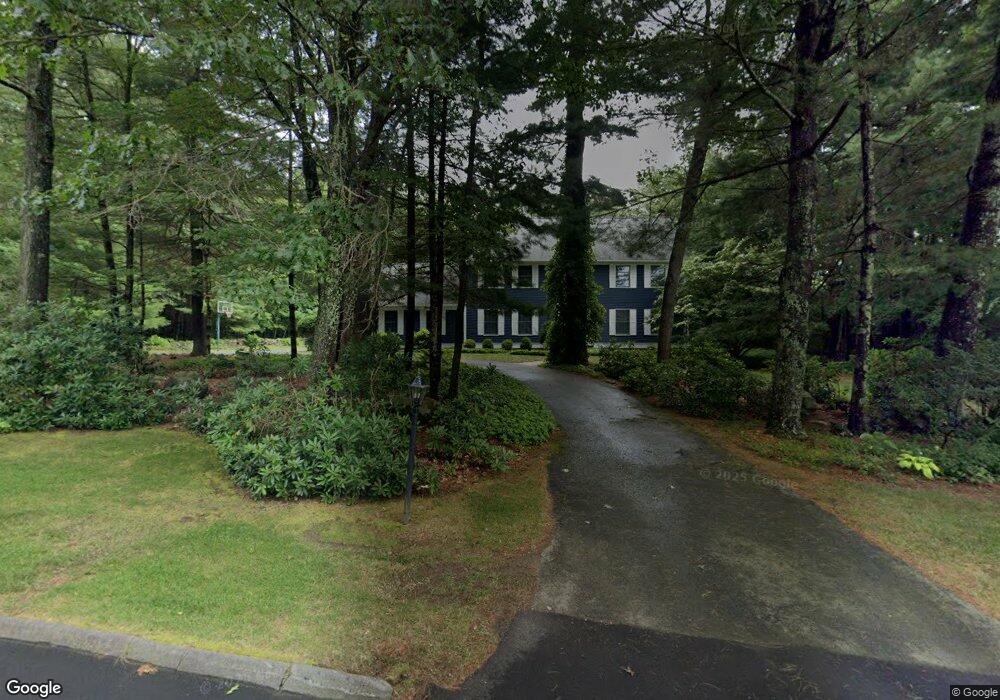
3 Stirrup Ln Wilbraham, MA 01095
Estimated Value: $654,000 - $800,000
4
Beds
4
Baths
2,722
Sq Ft
$262/Sq Ft
Est. Value
About This Home
This home is located at 3 Stirrup Ln, Wilbraham, MA 01095 and is currently estimated at $713,691, approximately $262 per square foot. 3 Stirrup Ln is a home located in Hampden County with nearby schools including Minnechaug Regional High School and Wilbraham & Monson Academy.
Ownership History
Date
Name
Owned For
Owner Type
Purchase Details
Closed on
Aug 15, 1997
Sold by
Richard C Smith T and Smith Richard C
Bought by
Sullivan Daniel G and Sullivan Patricia
Current Estimated Value
Home Financials for this Owner
Home Financials are based on the most recent Mortgage that was taken out on this home.
Original Mortgage
$242,400
Interest Rate
7.56%
Mortgage Type
Purchase Money Mortgage
Purchase Details
Closed on
Sep 24, 1993
Sold by
Wilbraview Lp
Bought by
Smith Richard C and Smith Gayle S
Create a Home Valuation Report for This Property
The Home Valuation Report is an in-depth analysis detailing your home's value as well as a comparison with similar homes in the area
Home Values in the Area
Average Home Value in this Area
Purchase History
| Date | Buyer | Sale Price | Title Company |
|---|---|---|---|
| Sullivan Daniel G | $303,000 | -- | |
| Smith Richard C | $60,000 | -- |
Source: Public Records
Mortgage History
| Date | Status | Borrower | Loan Amount |
|---|---|---|---|
| Open | Smith Richard C | $100,000 | |
| Open | Smith Richard C | $199,000 | |
| Closed | Smith Richard C | $242,400 | |
| Previous Owner | Smith Richard C | $172,500 |
Source: Public Records
Tax History Compared to Growth
Tax History
| Year | Tax Paid | Tax Assessment Tax Assessment Total Assessment is a certain percentage of the fair market value that is determined by local assessors to be the total taxable value of land and additions on the property. | Land | Improvement |
|---|---|---|---|---|
| 2025 | $11,016 | $616,100 | $132,400 | $483,700 |
| 2024 | $10,760 | $581,600 | $132,400 | $449,200 |
| 2023 | $9,731 | $523,000 | $132,400 | $390,600 |
| 2022 | $9,731 | $474,900 | $132,400 | $342,500 |
| 2021 | $9,724 | $423,500 | $131,100 | $292,400 |
| 2020 | $9,478 | $423,500 | $131,100 | $292,400 |
| 2019 | $9,232 | $423,500 | $131,100 | $292,400 |
| 2018 | $9,205 | $406,600 | $131,100 | $275,500 |
| 2017 | $8,945 | $406,600 | $131,100 | $275,500 |
| 2016 | $8,750 | $405,100 | $145,100 | $260,000 |
| 2015 | $8,458 | $405,100 | $145,100 | $260,000 |
Source: Public Records
Map
Nearby Homes
- 603 Glendale Rd
- 733 Monson Rd
- 60 Lakeshore Dr
- 12 Highridge Rd
- 474-480 Mountain Rd
- 474 Mountain Rd
- 6 Hilltop Park
- 72 Beebe Rd
- 17 Peak Rd
- 20 Old Orchard Rd
- 254 Ames Rd
- 68 Monson Rd
- 2 Bayberry Dr Unit 51
- 182 Mountain Rd
- 2 Vista Rd
- 8 Patriot Ridge Ln
- 28 Decorie Dr
- 79 High Pine Cir
- 69 High Pine Cir
- 54 High Pine Cir