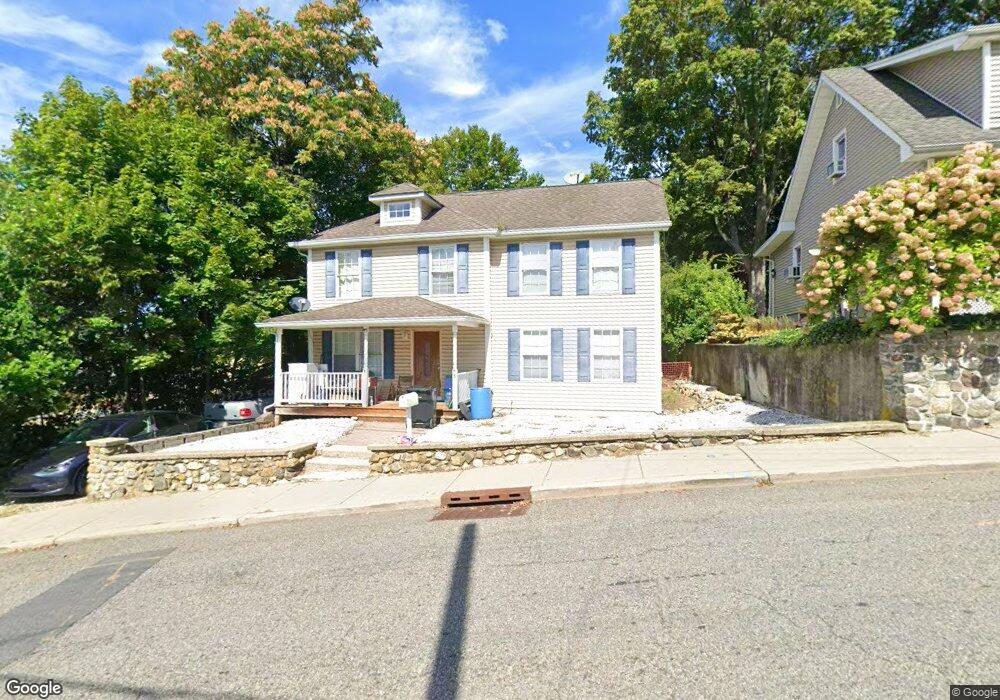
3 Stoll St Netcong, NJ 07857
Estimated Value: $468,000 - $546,000
Studio
--
Bath
1,792
Sq Ft
$275/Sq Ft
Est. Value
About This Home
This home is located at 3 Stoll St, Netcong, NJ 07857 and is currently estimated at $493,019, approximately $275 per square foot. 3 Stoll St is a home located in Morris County with nearby schools including Netcong Elementary School, Lenape Val Regional High School, and St. Therese School.
Ownership History
Date
Name
Owned For
Owner Type
Purchase Details
Closed on
Aug 23, 2007
Sold by
Engdahl Bradley
Bought by
Morin Lucien and Morin Madeleine
Current Estimated Value
Home Financials for this Owner
Home Financials are based on the most recent Mortgage that was taken out on this home.
Original Mortgage
$325,350
Outstanding Balance
$206,416
Interest Rate
6.7%
Mortgage Type
Purchase Money Mortgage
Estimated Equity
$286,603
Purchase Details
Closed on
Jun 29, 2006
Sold by
Rosolowski Wlodziamierz
Bought by
Engdahl Bradley
Purchase Details
Closed on
Apr 20, 2003
Sold by
Degraw Jack
Bought by
Rosolowski Wlodziamierz
Home Financials for this Owner
Home Financials are based on the most recent Mortgage that was taken out on this home.
Original Mortgage
$144,000
Interest Rate
5.64%
Purchase Details
Closed on
Apr 26, 1996
Sold by
Loose Emma
Bought by
Loose Emma and Degraw Jack
Create a Home Valuation Report for This Property
The Home Valuation Report is an in-depth analysis detailing your home's value as well as a comparison with similar homes in the area
Home Values in the Area
Average Home Value in this Area
Purchase History
| Date | Buyer | Sale Price | Title Company |
|---|---|---|---|
| Morin Lucien | $342,475 | Fidelity Natl Title Ins Co | |
| Engdahl Bradley | $220,000 | -- | |
| Rosolowski Wlodziamierz | $160,000 | -- | |
| Loose Emma | -- | -- |
Source: Public Records
Mortgage History
| Date | Status | Borrower | Loan Amount |
|---|---|---|---|
| Open | Morin Lucien | $325,350 | |
| Previous Owner | Rosolowski Wlodziamierz | $144,000 |
Source: Public Records
Tax History
| Year | Tax Paid | Tax Assessment Tax Assessment Total Assessment is a certain percentage of the fair market value that is determined by local assessors to be the total taxable value of land and additions on the property. | Land | Improvement |
|---|---|---|---|---|
| 2025 | $10,049 | $294,100 | $106,000 | $188,100 |
| 2024 | $10,138 | $294,100 | $106,000 | $188,100 |
Source: Public Records
Map
Nearby Homes
- 35 Hillside Ave
- 79 Main St
- 74 Main St
- 16-18 King St
- 8 Silas Rd
- 4 Elizabeth Ave
- 7 Walton Place
- 2 Roberts Place
- 64 Spino Dr
- 9 Spino Dr
- 8 Hillside Ave
- 0 Lawrence Ave
- 37 Fox Chase Ln
- 8 Spencer St
- 0 Swayze Pl Lawrence Ave
- 1 Smith St
- 329 Alpine Ct Unit 29
- 573 Dell Place Unit 73
- 579 Dell Place Unit 79
- 48 Old Budd Lake Rd
- 5 Stoll St
- 2 Allen Terrace
- 7 Stoll St
- 4 Allen Terrace
- 47 Ledgewood Ave
- 47 Ledgewood Ave Unit 1
- 5 College Rd
- 44 Ledgewood Ave
- 6 Allen Terrace
- 42 Ledgewood Ave
- 52 Maple Ave
- 39 Ledgewood Ave
- 7 College Rd
- 51 Maple Ave
- 8 Allen Terrace
- 11 Stoll St Unit 1
- 46 Ledgewood Ave
- 9 Stoll St Unit 2
- 9 Stoll St Unit 1
- 9 College Rd
Your Personal Tour Guide
Ask me questions while you tour the home.