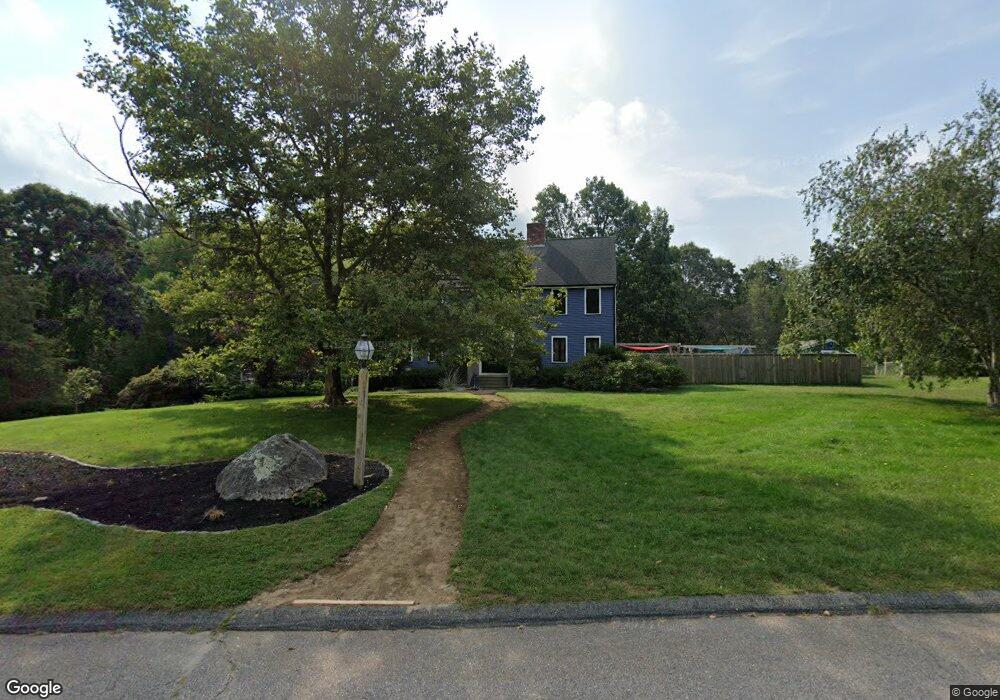
3 Stone End Rd Medway, MA 02053
Estimated Value: $781,244 - $842,000
4
Beds
3
Baths
2,514
Sq Ft
$322/Sq Ft
Est. Value
About This Home
This home is located at 3 Stone End Rd, Medway, MA 02053 and is currently estimated at $809,561, approximately $322 per square foot. 3 Stone End Rd is a home located in Norfolk County with nearby schools including John D. McGovern Elementary School, Burke-Memorial Elementary, and Medway Middle School.
Ownership History
Date
Name
Owned For
Owner Type
Purchase Details
Closed on
Sep 2, 2009
Sold by
Garian Richard N and Garian Sharon M
Bought by
Levasseur James E and Levasseur Elizabeth H
Current Estimated Value
Home Financials for this Owner
Home Financials are based on the most recent Mortgage that was taken out on this home.
Original Mortgage
$434,935
Outstanding Balance
$277,731
Interest Rate
5.21%
Mortgage Type
Purchase Money Mortgage
Estimated Equity
$531,830
Create a Home Valuation Report for This Property
The Home Valuation Report is an in-depth analysis detailing your home's value as well as a comparison with similar homes in the area
Home Values in the Area
Average Home Value in this Area
Purchase History
| Date | Buyer | Sale Price | Title Company |
|---|---|---|---|
| Levasseur James E | $450,000 | -- |
Source: Public Records
Mortgage History
| Date | Status | Borrower | Loan Amount |
|---|---|---|---|
| Open | Levasseur James E | $434,935 |
Source: Public Records
Tax History
| Year | Tax Paid | Tax Assessment Tax Assessment Total Assessment is a certain percentage of the fair market value that is determined by local assessors to be the total taxable value of land and additions on the property. | Land | Improvement |
|---|---|---|---|---|
| 2025 | $9,518 | $667,900 | $344,400 | $323,500 |
| 2024 | $9,618 | $667,900 | $344,400 | $323,500 |
| 2023 | $9,602 | $602,400 | $313,900 | $288,500 |
| 2022 | $8,392 | $495,700 | $233,300 | $262,400 |
| 2021 | $8,367 | $479,200 | $218,000 | $261,200 |
| 2020 | $8,218 | $469,600 | $218,000 | $251,600 |
| 2019 | $7,755 | $457,000 | $209,300 | $247,700 |
| 2018 | $7,816 | $442,600 | $200,600 | $242,000 |
| 2017 | $7,829 | $436,900 | $196,300 | $240,600 |
| 2016 | $7,635 | $421,600 | $181,000 | $240,600 |
| 2015 | $7,577 | $415,400 | $178,800 | $236,600 |
| 2014 | $7,628 | $404,900 | $183,400 | $221,500 |
Source: Public Records
Map
Nearby Homes
- 23 Cedar Farms Rd
- 8 Liberty Rd
- 56 Fisher St
- 3 Nobscott Rd
- 15 Fox Run Rd
- 22 Granite St
- 190-194 E Main St
- 6 Kingson Ln Unit 2
- 45 Wendy Ln
- 39 West St
- 2 Kingson Ln Unit 2
- 4 Waterfall Ln
- 4 Bullard Cir
- 3 Thayer Rd
- 6 Freedom Trail
- 50 Morgans Way
- 35 Woodland Ave Unit 35A
- 462 Hartford Ave
- 15 Black Bear Cir Unit 15
- 13 Black Bear Cir Unit 13
Your Personal Tour Guide
Ask me questions while you tour the home.