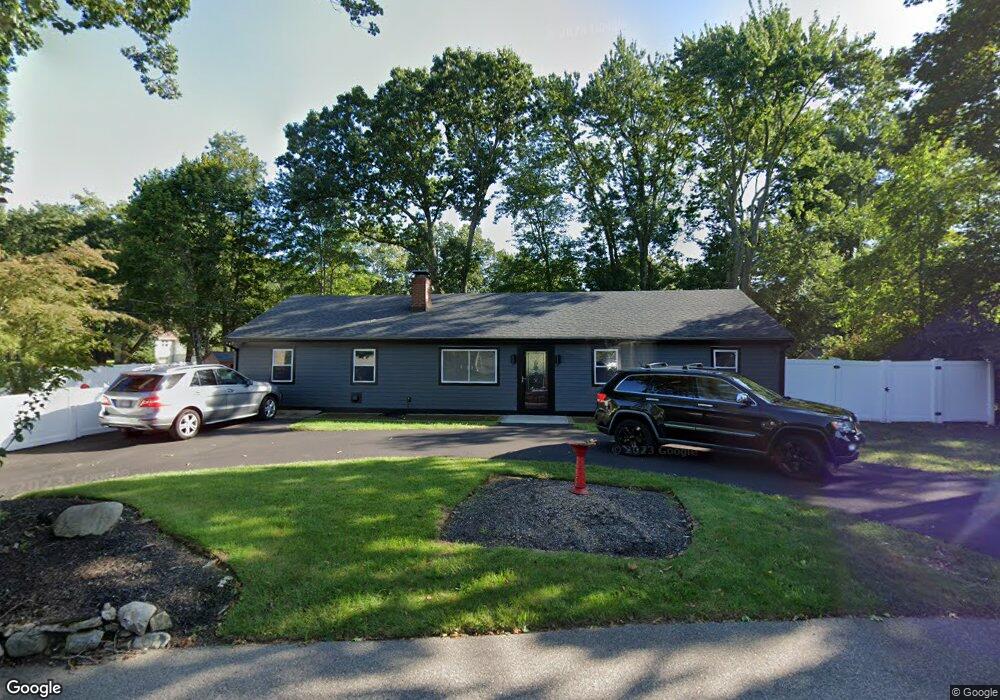
3 Stonybrook Rd Sharon, MA 02067
Estimated Value: $651,000 - $697,820
3
Beds
2
Baths
1,668
Sq Ft
$400/Sq Ft
Est. Value
About This Home
This home is located at 3 Stonybrook Rd, Sharon, MA 02067 and is currently estimated at $667,705, approximately $400 per square foot. 3 Stonybrook Rd is a home located in Norfolk County with nearby schools including East Elementary School, Sharon Middle School, and Sharon High School.
Ownership History
Date
Name
Owned For
Owner Type
Purchase Details
Closed on
Oct 16, 2025
Sold by
Sadrzadeh Maryann and Sadrzadeh Kasra
Bought by
Sadrzadeh Ft and Sadrzadeh
Current Estimated Value
Purchase Details
Closed on
Dec 1, 1995
Sold by
David Joan and David Francis L
Bought by
Cooper Maryann
Home Financials for this Owner
Home Financials are based on the most recent Mortgage that was taken out on this home.
Original Mortgage
$135,000
Interest Rate
7.37%
Mortgage Type
Purchase Money Mortgage
Create a Home Valuation Report for This Property
The Home Valuation Report is an in-depth analysis detailing your home's value as well as a comparison with similar homes in the area
Home Values in the Area
Average Home Value in this Area
Purchase History
| Date | Buyer | Sale Price | Title Company |
|---|---|---|---|
| Sadrzadeh Ft | -- | -- | |
| Cooper Maryann | $150,000 | -- | |
| Cooper Maryann | $150,000 | -- |
Source: Public Records
Mortgage History
| Date | Status | Borrower | Loan Amount |
|---|---|---|---|
| Previous Owner | Cooper Maryann | $132,000 | |
| Previous Owner | Cooper Maryann | $135,000 | |
| Previous Owner | Cooper Maryann | $60,000 |
Source: Public Records
Tax History
| Year | Tax Paid | Tax Assessment Tax Assessment Total Assessment is a certain percentage of the fair market value that is determined by local assessors to be the total taxable value of land and additions on the property. | Land | Improvement |
|---|---|---|---|---|
| 2025 | $9,233 | $528,200 | $369,600 | $158,600 |
| 2024 | $8,822 | $501,800 | $339,100 | $162,700 |
| 2023 | $8,637 | $464,600 | $316,900 | $147,700 |
| 2022 | $8,240 | $417,200 | $264,000 | $153,200 |
| 2021 | $7,627 | $373,300 | $224,200 | $149,100 |
| 2020 | $6,952 | $365,900 | $216,800 | $149,100 |
| 2019 | $6,629 | $341,500 | $200,600 | $140,900 |
| 2018 | $6,539 | $337,600 | $196,700 | $140,900 |
| 2017 | $6,373 | $324,800 | $183,900 | $140,900 |
| 2016 | $6,284 | $312,500 | $183,900 | $128,600 |
| 2015 | $5,826 | $287,000 | $168,600 | $118,400 |
| 2014 | $5,707 | $277,700 | $168,500 | $109,200 |
Source: Public Records
Map
Nearby Homes
- 329 N Main St
- 2 Trowel Shop Pond Rd Unit 2
- 42 Bayberry Dr Unit 1
- 11 Robs Ln
- 2196 Central St
- 12 Eastwood Rd
- 90 Charles Cir
- 42 Glendale Rd
- 63 Highland St
- 64 Richards Ave
- 17 Apple Valley Dr
- 221 High St
- 20 Lyndon Rd
- 61 Lincoln Rd
- 36 Jessica Dr Unit H
- 6 Jessica Dr Unit E
- 47 Orchard Hill Dr
- 52 Edward Dr Unit 52
- 72 Kim Terrace Unit C
- 29 Station St
Your Personal Tour Guide
Ask me questions while you tour the home.