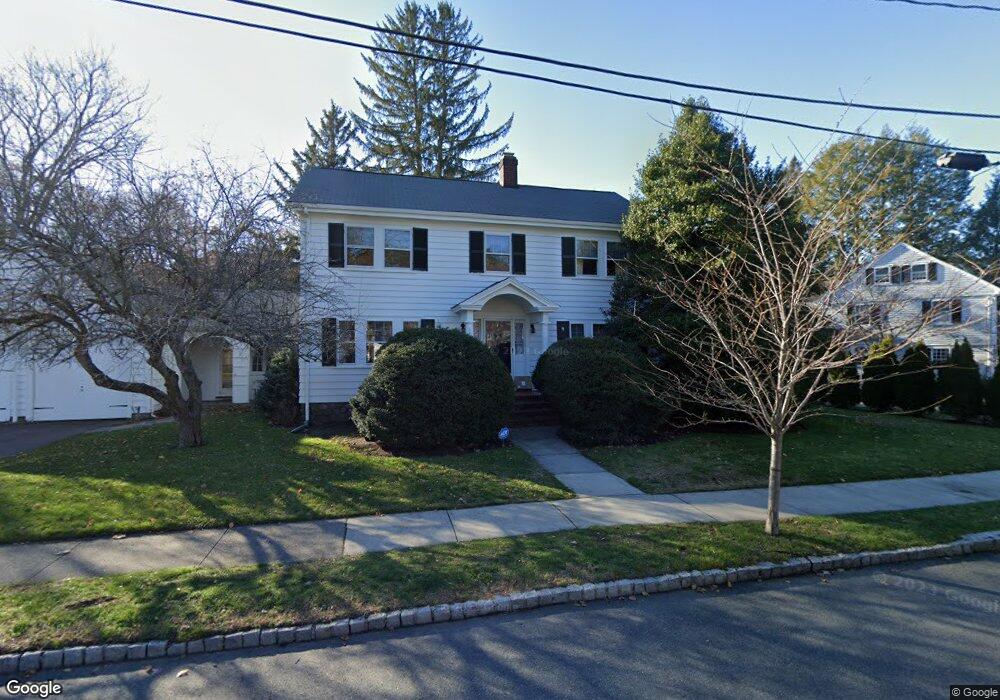
3 Stowell Rd Winchester, MA 01890
Symmes Corner NeighborhoodEstimated Value: $1,257,000 - $1,606,000
3
Beds
2
Baths
2,030
Sq Ft
$702/Sq Ft
Est. Value
About This Home
This home is located at 3 Stowell Rd, Winchester, MA 01890 and is currently estimated at $1,425,394, approximately $702 per square foot. 3 Stowell Rd is a home located in Middlesex County with nearby schools including Lincoln Elementary School, McCall Middle School, and Winchester High School.
Ownership History
Date
Name
Owned For
Owner Type
Purchase Details
Closed on
Jul 19, 2016
Sold by
Popp Alexander M and Popp Linda C
Bought by
Alexander Popp T and Alexander Popp
Current Estimated Value
Purchase Details
Closed on
Oct 4, 1984
Bought by
Popp Alexander M and Popp Linda C
Create a Home Valuation Report for This Property
The Home Valuation Report is an in-depth analysis detailing your home's value as well as a comparison with similar homes in the area
Home Values in the Area
Average Home Value in this Area
Purchase History
| Date | Buyer | Sale Price | Title Company |
|---|---|---|---|
| Alexander Popp T | -- | -- | |
| Popp Alexander M | $175,000 | -- |
Source: Public Records
Mortgage History
| Date | Status | Borrower | Loan Amount |
|---|---|---|---|
| Previous Owner | Popp Alexander M | $150,000 | |
| Previous Owner | Popp Alexander M | $20,000 | |
| Previous Owner | Popp Alexander M | $57,000 |
Source: Public Records
Tax History
| Year | Tax Paid | Tax Assessment Tax Assessment Total Assessment is a certain percentage of the fair market value that is determined by local assessors to be the total taxable value of land and additions on the property. | Land | Improvement |
|---|---|---|---|---|
| 2025 | $152 | $1,373,800 | $912,600 | $461,200 |
| 2024 | $13,798 | $1,217,800 | $847,400 | $370,400 |
| 2023 | $13,529 | $1,146,500 | $782,200 | $364,300 |
| 2022 | $12,867 | $1,028,500 | $684,500 | $344,000 |
| 2021 | $12,463 | $971,400 | $627,400 | $344,000 |
| 2020 | $12,036 | $971,400 | $627,400 | $344,000 |
| 2019 | $10,777 | $889,900 | $545,900 | $344,000 |
| 2018 | $10,407 | $853,700 | $519,900 | $333,800 |
| 2017 | $10,234 | $833,400 | $519,900 | $313,500 |
| 2016 | $9,618 | $823,500 | $519,900 | $303,600 |
| 2015 | $9,275 | $764,000 | $472,600 | $291,400 |
| 2014 | $8,563 | $676,400 | $395,200 | $281,200 |
Source: Public Records
Map
Nearby Homes
- 6 Marchant Rd
- 17 Cranston Rd
- 1 Town Way
- 45 Bacon St
- 4 Leslie Rd
- 19 Town Way
- 2 Priscilla Ln
- 9 Lakeview Terrace
- 2 Canterbury Rd
- 39 Town Way
- 61 Grove St
- 20 Grove Place
- 53 Winford Way
- 35 Hollywood Rd
- 27 Everett Ave
- 10 Sheffield W
- 263 Highland Ave
- 115 Washington St Unit 2A
- 666 Main St Unit 315
- 25 Myopia Rd
Your Personal Tour Guide
Ask me questions while you tour the home.