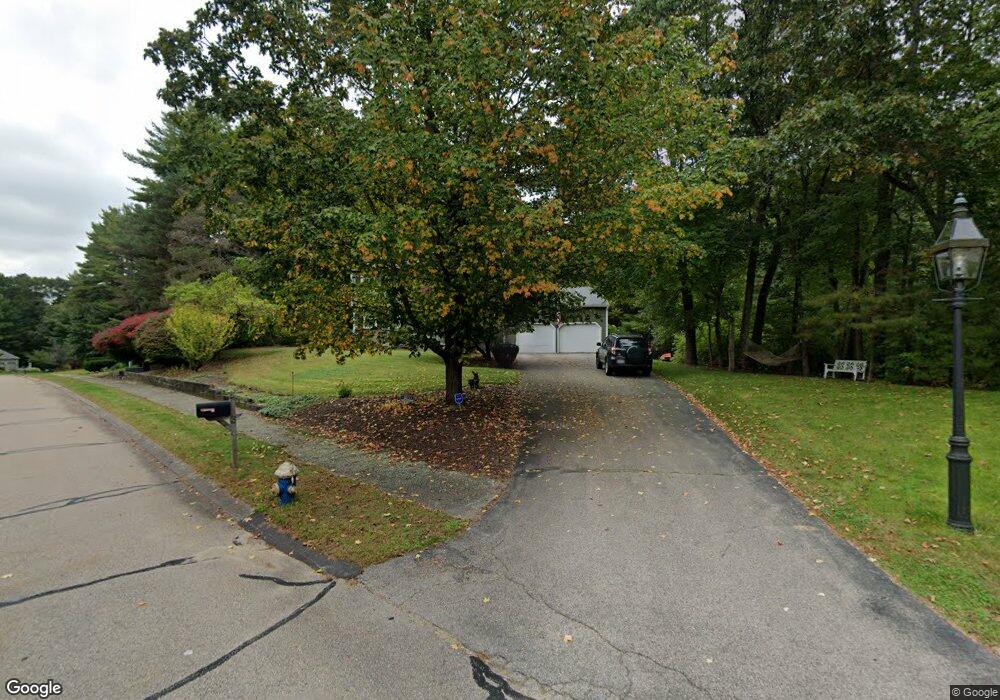
3 Tara Ann Dr Foxboro, MA 02035
Estimated Value: $715,000 - $818,000
4
Beds
3
Baths
1,800
Sq Ft
$418/Sq Ft
Est. Value
About This Home
This home is located at 3 Tara Ann Dr, Foxboro, MA 02035 and is currently estimated at $752,414, approximately $418 per square foot. 3 Tara Ann Dr is a home located in Norfolk County with nearby schools including Foxborough High School, Foxborough Regional Charter School, and Hands-On-Montessori School.
Ownership History
Date
Name
Owned For
Owner Type
Purchase Details
Closed on
Aug 14, 2023
Sold by
Garber Robert T and Garber Ellen M
Bought by
Garber Ft and Garber
Current Estimated Value
Purchase Details
Closed on
Feb 28, 2001
Sold by
Dewolf Nina L
Bought by
Garber Robert T and Garber Ellen M
Home Financials for this Owner
Home Financials are based on the most recent Mortgage that was taken out on this home.
Original Mortgage
$135,000
Interest Rate
7%
Mortgage Type
Purchase Money Mortgage
Create a Home Valuation Report for This Property
The Home Valuation Report is an in-depth analysis detailing your home's value as well as a comparison with similar homes in the area
Home Values in the Area
Average Home Value in this Area
Purchase History
| Date | Buyer | Sale Price | Title Company |
|---|---|---|---|
| Garber Ft | -- | None Available | |
| Garber Robert T | $319,000 | -- |
Source: Public Records
Mortgage History
| Date | Status | Borrower | Loan Amount |
|---|---|---|---|
| Previous Owner | Garber Robert T | $127,199 | |
| Previous Owner | Garber Robert T | $135,000 |
Source: Public Records
Tax History Compared to Growth
Tax History
| Year | Tax Paid | Tax Assessment Tax Assessment Total Assessment is a certain percentage of the fair market value that is determined by local assessors to be the total taxable value of land and additions on the property. | Land | Improvement |
|---|---|---|---|---|
| 2025 | $7,985 | $604,000 | $262,000 | $342,000 |
| 2024 | $7,664 | $567,300 | $262,000 | $305,300 |
| 2023 | $7,438 | $523,400 | $249,600 | $273,800 |
| 2022 | $7,275 | $501,000 | $238,900 | $262,100 |
| 2021 | $7,002 | $475,000 | $217,200 | $257,800 |
| 2020 | $6,798 | $466,600 | $217,200 | $249,400 |
| 2019 | $6,456 | $439,200 | $206,800 | $232,400 |
| 2018 | $6,307 | $432,900 | $206,800 | $226,100 |
| 2017 | $6,076 | $404,000 | $193,200 | $210,800 |
| 2016 | $5,916 | $399,200 | $186,100 | $213,100 |
| 2015 | $5,786 | $380,900 | $157,100 | $223,800 |
| 2014 | $5,599 | $373,500 | $154,000 | $219,500 |
Source: Public Records
Map
Nearby Homes
- 406 South St
- 80 Mill St
- 16 Treasure Island Rd
- 9 Oak Dr
- 483 Thurston St
- 120 Hawes St
- 24 Maverick Dr
- 126 Washington St
- 130 Washington St
- 124 Washington St
- 450 West St
- 160 Washington St Unit 36
- 158 Washington St
- 356 Central St
- 65 Pond St
- 12 Spring St
- 116 George St
- 4 Buckskin Dr
- 11 Orchard Place Unit 11
- 28 Messenger St