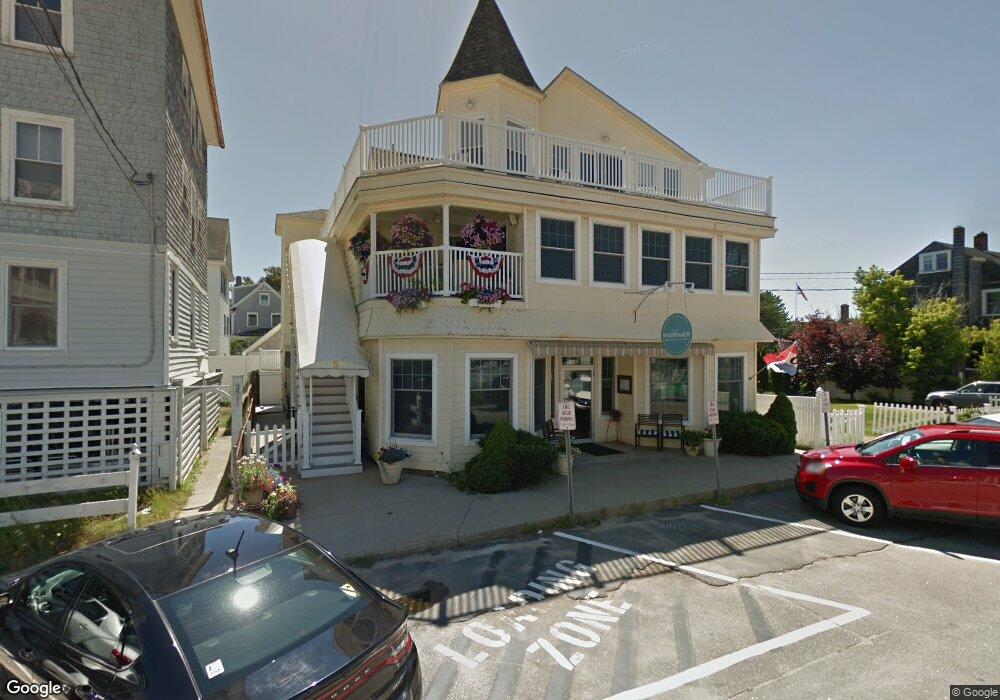
3 Temple Ave Old Orchard Beach, ME 04064
Estimated Value: $611,000 - $1,056,428
3
Beds
1
Bath
1,098
Sq Ft
$744/Sq Ft
Est. Value
About This Home
This home is located at 3 Temple Ave, Old Orchard Beach, ME 04064 and is currently estimated at $817,143, approximately $744 per square foot. 3 Temple Ave is a home located in York County with nearby schools including Jameson Elementary School, Loranger Memorial School, and Old Orchard Beach High School.
Ownership History
Date
Name
Owned For
Owner Type
Purchase Details
Closed on
May 10, 2016
Sold by
Vinikoor Robert L
Bought by
Robert L Vinikoor Ret and Vinikoor
Current Estimated Value
Purchase Details
Closed on
Jul 7, 2009
Sold by
Johnson Mark A
Bought by
Vinikoor Robert L and Vinikoor Sheila E
Home Financials for this Owner
Home Financials are based on the most recent Mortgage that was taken out on this home.
Original Mortgage
$368,000
Interest Rate
4.86%
Mortgage Type
Unknown
Create a Home Valuation Report for This Property
The Home Valuation Report is an in-depth analysis detailing your home's value as well as a comparison with similar homes in the area
Home Values in the Area
Average Home Value in this Area
Purchase History
| Date | Buyer | Sale Price | Title Company |
|---|---|---|---|
| Robert L Vinikoor Ret | -- | -- | |
| Robert L Vinikoor Ret | -- | -- | |
| Vinikoor Robert L | -- | -- | |
| Vinikoor Robert L | -- | -- |
Source: Public Records
Mortgage History
| Date | Status | Borrower | Loan Amount |
|---|---|---|---|
| Closed | Vinikoor Robert L | $364,000 | |
| Closed | Vinikoor Robert L | $368,000 |
Source: Public Records
Tax History Compared to Growth
Tax History
| Year | Tax Paid | Tax Assessment Tax Assessment Total Assessment is a certain percentage of the fair market value that is determined by local assessors to be the total taxable value of land and additions on the property. | Land | Improvement |
|---|---|---|---|---|
| 2024 | $11,075 | $1,017,900 | $830,700 | $187,200 |
| 2023 | $10,865 | $953,100 | $787,900 | $165,200 |
| 2022 | $10,220 | $835,000 | $685,200 | $149,800 |
| 2021 | $9,341 | $659,700 | $542,200 | $117,500 |
| 2020 | $8,745 | $567,100 | $458,100 | $109,000 |
| 2019 | $8,553 | $551,800 | $458,100 | $93,700 |
| 2018 | $8,413 | $549,900 | $458,100 | $91,800 |
| 2017 | $7,406 | $471,700 | $384,500 | $87,200 |
| 2016 | $7,098 | $459,100 | $371,900 | $87,200 |
| 2015 | $6,969 | $459,100 | $371,900 | $87,200 |
| 2014 | $6,831 | $459,100 | $371,900 | $87,200 |
| 2013 | $6,336 | $459,100 | $371,900 | $87,200 |
Source: Public Records
Map
Nearby Homes
- 17 Randall Ave
- 5 Blaine Rd Unit 101
- 5 Blaine Rd Unit 104
- 5 Blaine Rd Unit 102
- 5 Blaine Rd
- 5 Blaine Rd Unit 103
- 1 Ocean Ave
- 2 Union Ave
- 4 Union Ave
- 16 Union Ave
- 3 Bay Ave Unit 23
- 9 Fern Ave
- 3 Central Ave
- 88 Union Ave Unit 301
- 105 Union Ave
- 161 Saco Ave Unit 113
- 29 15th St
- 5 4th Ave
- 39 W Grand Ave Unit 410
- 39 W Grand Ave Unit 510
- 1 Temple Ave
- 5 Temple Ave
- 2 Randall Ave
- 7 Temple Ave
- 4 Randall Ave
- 2 Temple Unit Beach Rose
- 2 Temple Unit Sun Rise
- 2 Temple Unit The Colby
- 2 Temple Unit Saco Bay Suite
- 2 Temple
- 4 Temple Ave
- 3 Randall Ave
- 1 Randall Ave
- 6 Temple Ave
- 8 Randall Ave
- 5 Randall Ave
- 9 Temple Ave
- 3 Colby Ave
- 5 Randall Ave
- 10 Weymouth Ave