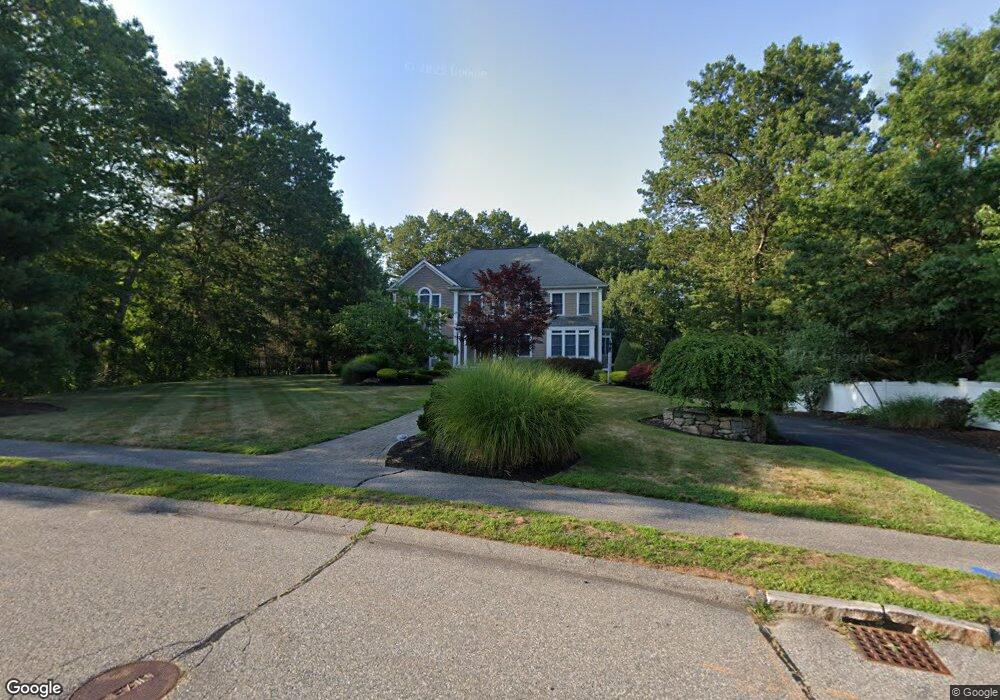
3 Thornton Cir Middleton, MA 01949
Estimated Value: $1,410,000 - $1,848,000
4
Beds
4
Baths
3,707
Sq Ft
$422/Sq Ft
Est. Value
About This Home
This home is located at 3 Thornton Cir, Middleton, MA 01949 and is currently estimated at $1,563,475, approximately $421 per square foot. 3 Thornton Cir is a home located in Essex County with nearby schools including Howe-Manning Elementary School, Fuller Meadow Elementary School, and Masconomet Regional Middle School.
Ownership History
Date
Name
Owned For
Owner Type
Purchase Details
Closed on
Mar 12, 2018
Sold by
Ciulla Lisa and Ciulla Michael
Bought by
Su Shizhen
Current Estimated Value
Home Financials for this Owner
Home Financials are based on the most recent Mortgage that was taken out on this home.
Original Mortgage
$453,000
Outstanding Balance
$384,310
Interest Rate
4.15%
Mortgage Type
New Conventional
Estimated Equity
$1,179,165
Purchase Details
Closed on
Nov 21, 1997
Sold by
Damon Rt
Bought by
Ciulla Michael and Ciulla Lisa
Create a Home Valuation Report for This Property
The Home Valuation Report is an in-depth analysis detailing your home's value as well as a comparison with similar homes in the area
Home Values in the Area
Average Home Value in this Area
Purchase History
| Date | Buyer | Sale Price | Title Company |
|---|---|---|---|
| Su Shizhen | $956,000 | -- | |
| Su Shizhen | $956,000 | -- | |
| Su Shizhen | $956,000 | -- | |
| Ciulla Michael | $150,000 | -- | |
| Ciulla Michael | $150,000 | -- |
Source: Public Records
Mortgage History
| Date | Status | Borrower | Loan Amount |
|---|---|---|---|
| Open | Su Shizhen | $453,000 | |
| Closed | Su Shizhen | $453,000 | |
| Previous Owner | Ciulla Michael | $310,000 | |
| Previous Owner | Ciulla Michael | $323,000 |
Source: Public Records
Tax History Compared to Growth
Tax History
| Year | Tax Paid | Tax Assessment Tax Assessment Total Assessment is a certain percentage of the fair market value that is determined by local assessors to be the total taxable value of land and additions on the property. | Land | Improvement |
|---|---|---|---|---|
| 2025 | $17,116 | $1,439,500 | $430,000 | $1,009,500 |
| 2024 | $16,341 | $1,386,000 | $402,000 | $984,000 |
| 2023 | $18,188 | $1,413,200 | $622,000 | $791,200 |
| 2022 | $13,856 | $1,045,700 | $346,000 | $699,700 |
| 2021 | $14,037 | $1,023,100 | $344,000 | $679,100 |
| 2020 | $12,212 | $896,600 | $344,000 | $552,600 |
| 2019 | $11,396 | $832,400 | $298,000 | $534,400 |
| 2018 | $11,468 | $821,500 | $298,000 | $523,500 |
| 2017 | $11,672 | $836,700 | $320,000 | $516,700 |
| 2016 | $10,551 | $759,600 | $250,000 | $509,600 |
| 2015 | $10,842 | $786,800 | $280,000 | $506,800 |
Source: Public Records
Map
Nearby Homes
- 6 White Ln
- 62 Cabral Dr
- 2 Tyler Ln
- 15 Couture Way
- 1 Overbrook Rd
- 1 Couture Way
- 119 River St
- 1 Mills Point Unit 1
- 28 Niblick Way
- 44 Brassie Way
- 8 Brookside Rd
- 103 Elm St
- 5 Theresa Rd
- 53 N Main St Unit 53
- 49 Maple St Unit B
- 39 Central St
- 1466 Main St
- 37 Peaslee Cir Unit 37
- 62 Catherine Dr
- 10 Dogwood Ln