3 Tiger Row Georgetown, MA 01833
Estimated Value: $730,000 - $855,000
3
Beds
2
Baths
2,243
Sq Ft
$354/Sq Ft
Est. Value
About This Home
This home is located at 3 Tiger Row, Georgetown, MA 01833 and is currently estimated at $794,757, approximately $354 per square foot. 3 Tiger Row is a home located in Essex County with nearby schools including Perley Elementary School, Penn Brook School, and Georgetown High School.
Ownership History
Date
Name
Owned For
Owner Type
Purchase Details
Closed on
Mar 5, 2024
Sold by
Bowles John W and Bowles Marie D
Bought by
Bowles Ft and Bowles
Current Estimated Value
Purchase Details
Closed on
Sep 22, 1993
Sold by
Thurlow Nt and Perry
Bought by
Bowles John W and Bowles Marie
Home Financials for this Owner
Home Financials are based on the most recent Mortgage that was taken out on this home.
Original Mortgage
$183,000
Interest Rate
7.1%
Mortgage Type
Purchase Money Mortgage
Create a Home Valuation Report for This Property
The Home Valuation Report is an in-depth analysis detailing your home's value as well as a comparison with similar homes in the area
Home Values in the Area
Average Home Value in this Area
Purchase History
| Date | Buyer | Sale Price | Title Company |
|---|---|---|---|
| Bowles Ft | -- | None Available | |
| Bowles John W | $89,900 | -- |
Source: Public Records
Mortgage History
| Date | Status | Borrower | Loan Amount |
|---|---|---|---|
| Previous Owner | Bowles John W | $160,000 | |
| Previous Owner | Bowles John W | $174,000 | |
| Previous Owner | Bowles John W | $182,500 | |
| Previous Owner | Bowles John W | $183,000 |
Source: Public Records
Tax History
| Year | Tax Paid | Tax Assessment Tax Assessment Total Assessment is a certain percentage of the fair market value that is determined by local assessors to be the total taxable value of land and additions on the property. | Land | Improvement |
|---|---|---|---|---|
| 2025 | $8,825 | $797,900 | $321,600 | $476,300 |
| 2024 | $8,452 | $673,500 | $221,800 | $451,700 |
| 2023 | $8,675 | $668,300 | $221,800 | $446,500 |
| 2022 | $8,403 | $596,800 | $192,800 | $404,000 |
| 2021 | $8,225 | $517,600 | $192,800 | $324,800 |
| 2020 | $8,240 | $517,600 | $192,800 | $324,800 |
| 2019 | $8,111 | $514,000 | $189,200 | $324,800 |
| 2018 | $7,200 | $453,400 | $189,200 | $264,200 |
| 2017 | $6,977 | $430,400 | $189,200 | $241,200 |
| 2016 | $6,750 | $425,300 | $189,200 | $236,100 |
| 2015 | $7,101 | $443,000 | $189,200 | $253,800 |
| 2014 | $6,224 | $443,000 | $189,200 | $253,800 |
Source: Public Records
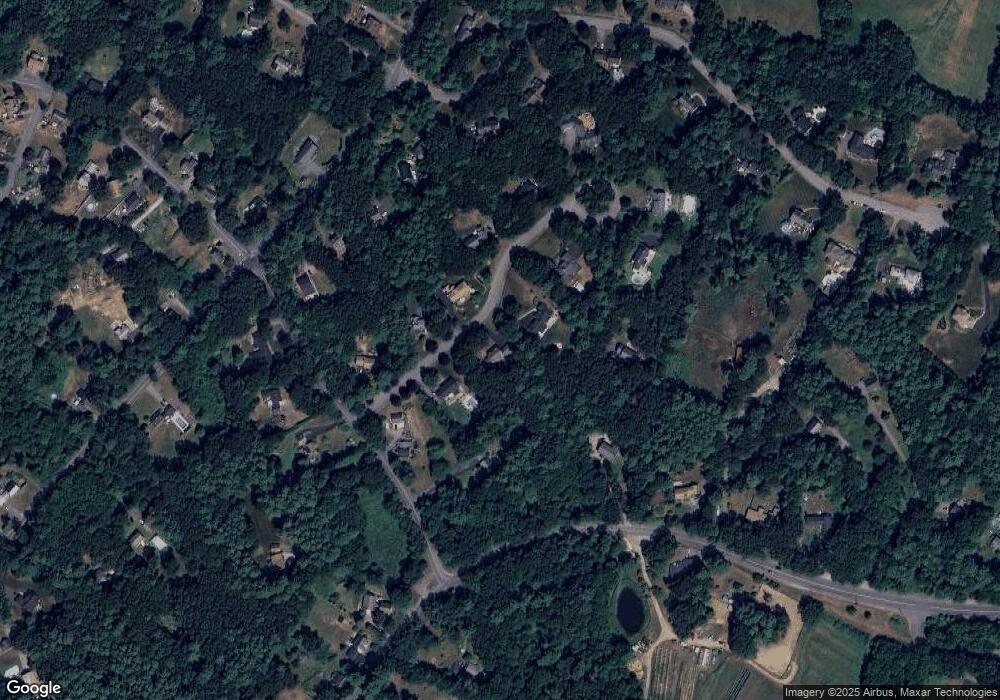
Map
Nearby Homes
Your Personal Tour Guide
Ask me questions while you tour the home.