3 Timberline Dr Mansfield, MA 02048
Estimated Value: $802,000 - $881,000
4
Beds
4
Baths
2,250
Sq Ft
$369/Sq Ft
Est. Value
About This Home
This home is located at 3 Timberline Dr, Mansfield, MA 02048 and is currently estimated at $830,994, approximately $369 per square foot. 3 Timberline Dr is a home located in Bristol County with nearby schools including Everett W. Robinson Elementary School, Jordan/Jackson Elementary School, and Harold L. Qualters Middle School.
Ownership History
Date
Name
Owned For
Owner Type
Purchase Details
Closed on
Nov 21, 1989
Sold by
J Brugliera Const
Bought by
Deponte Ernesto P
Current Estimated Value
Create a Home Valuation Report for This Property
The Home Valuation Report is an in-depth analysis detailing your home's value as well as a comparison with similar homes in the area
Home Values in the Area
Average Home Value in this Area
Purchase History
| Date | Buyer | Sale Price | Title Company |
|---|---|---|---|
| Deponte Ernesto P | $269,134 | -- |
Source: Public Records
Mortgage History
| Date | Status | Borrower | Loan Amount |
|---|---|---|---|
| Open | Deponte Ernesto P | $40,000 | |
| Closed | Deponte Ernesto P | $20,000 | |
| Open | Deponte Ernesto P | $132,000 | |
| Closed | Deponte Ernesto P | $150,000 |
Source: Public Records
Tax History
| Year | Tax Paid | Tax Assessment Tax Assessment Total Assessment is a certain percentage of the fair market value that is determined by local assessors to be the total taxable value of land and additions on the property. | Land | Improvement |
|---|---|---|---|---|
| 2025 | $9,403 | $714,000 | $278,500 | $435,500 |
| 2024 | $9,156 | $678,200 | $290,600 | $387,600 |
| 2023 | $8,864 | $629,100 | $290,600 | $338,500 |
| 2022 | $8,523 | $561,800 | $269,000 | $292,800 |
| 2021 | $8,259 | $537,700 | $224,300 | $313,400 |
| 2020 | $8,132 | $529,400 | $224,300 | $305,100 |
| 2019 | $7,528 | $494,600 | $186,800 | $307,800 |
| 2018 | $7,480 | $480,400 | $178,100 | $302,300 |
| 2017 | $7,016 | $467,100 | $173,100 | $294,000 |
| 2016 | $6,776 | $439,700 | $164,800 | $274,900 |
| 2015 | $6,598 | $425,700 | $164,800 | $260,900 |
Source: Public Records
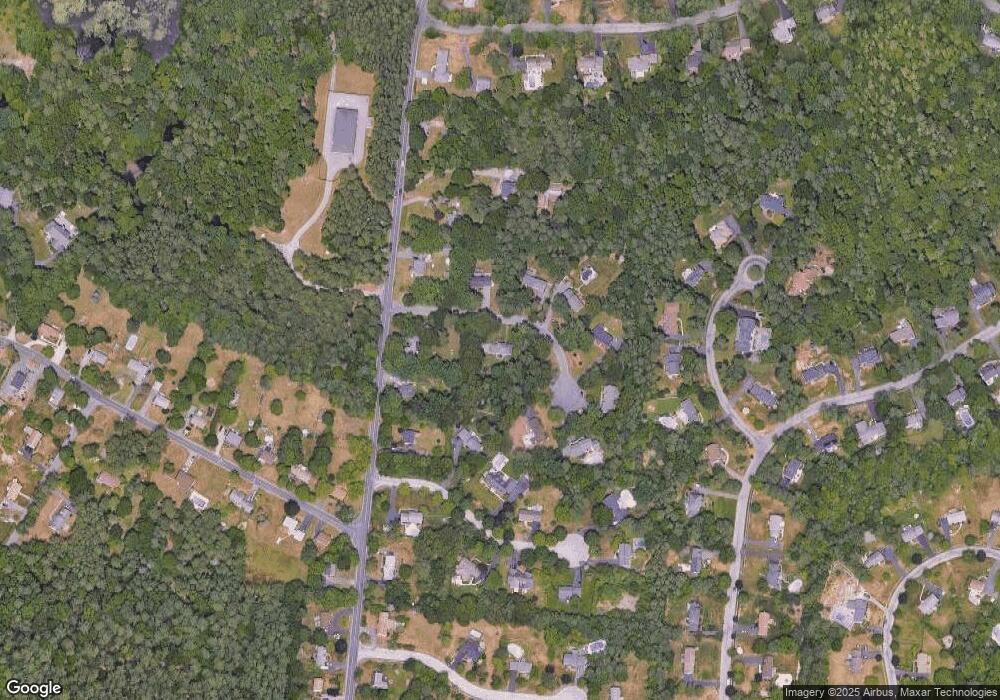
Map
Nearby Homes
- 24 Maverick Dr
- 150 Gilbert St
- 128 Tremont St
- 25 Shepherd St
- 14 Claire Ave
- 25 Munroe Dr
- 17 Childs Ln
- 84 Messenger St
- 115 Westfield Dr
- 9 Coach Rd
- 57 Vine St
- 49 Pheasant Hill Rd
- 451R Gilbert St
- 33 Colonial Way
- 1769 West St
- 40 Treasure Island Rd
- 2 Oak St Unit 2B
- Lot 5 Jeffrey Dr
- 16 Treasure Island Rd
- Lot 2 Jeffrey Dr
Your Personal Tour Guide
Ask me questions while you tour the home.