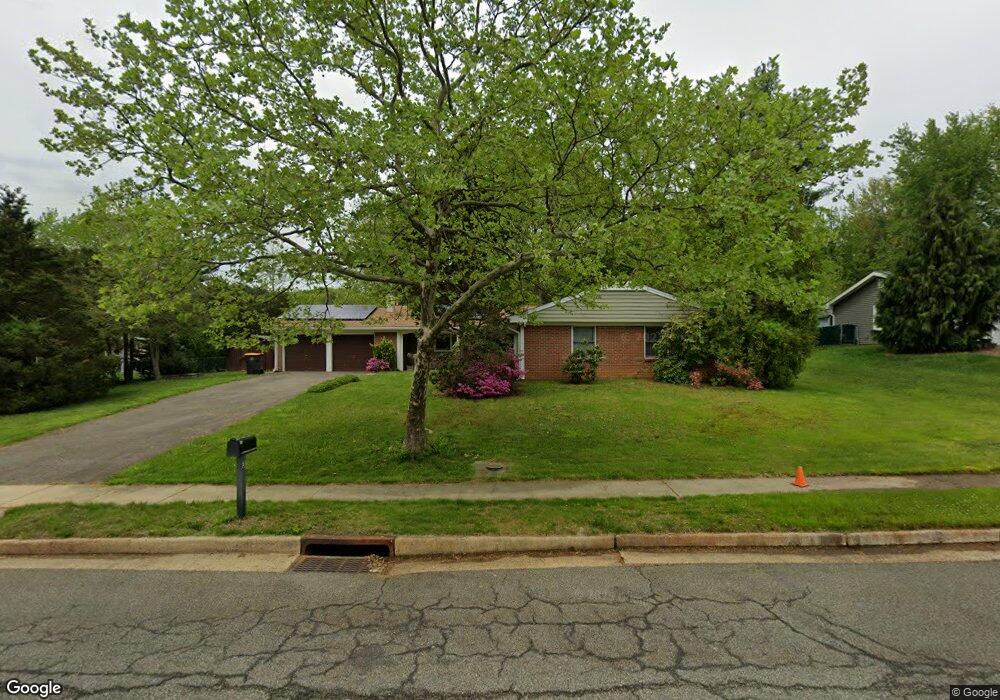
3 Timon Dr Old Bridge, NJ 08857
Estimated Value: $620,000 - $743,000
Studio
--
Bath
1,964
Sq Ft
$356/Sq Ft
Est. Value
About This Home
This home is located at 3 Timon Dr, Old Bridge, NJ 08857 and is currently estimated at $698,544, approximately $355 per square foot. 3 Timon Dr is a home located in Middlesex County with nearby schools including Old Bridge High School, St. Ambrose School, and Calvary Christian School.
Ownership History
Date
Name
Owned For
Owner Type
Purchase Details
Closed on
Apr 19, 2021
Sold by
Chisholm Ronald C
Bought by
Wong Sean C and Dejesus Jennifer M
Current Estimated Value
Home Financials for this Owner
Home Financials are based on the most recent Mortgage that was taken out on this home.
Original Mortgage
$360,000
Outstanding Balance
$325,555
Interest Rate
3.1%
Mortgage Type
New Conventional
Estimated Equity
$372,989
Purchase Details
Closed on
Dec 13, 1966
Bought by
Chisholm Ronald and Chisholm Amelia
Create a Home Valuation Report for This Property
The Home Valuation Report is an in-depth analysis detailing your home's value as well as a comparison with similar homes in the area
Home Values in the Area
Average Home Value in this Area
Purchase History
| Date | Buyer | Sale Price | Title Company |
|---|---|---|---|
| Wong Sean C | $400,000 | Suburban Title Examiners Inc | |
| Wong Sean C | $400,000 | Old Republic Title | |
| Chisholm Ronald | -- | -- |
Source: Public Records
Mortgage History
| Date | Status | Borrower | Loan Amount |
|---|---|---|---|
| Open | Wong Sean C | $360,000 | |
| Closed | Wong Sean C | $360,000 |
Source: Public Records
Tax History
| Year | Tax Paid | Tax Assessment Tax Assessment Total Assessment is a certain percentage of the fair market value that is determined by local assessors to be the total taxable value of land and additions on the property. | Land | Improvement |
|---|---|---|---|---|
| 2025 | $9,301 | $164,700 | $62,700 | $102,000 |
| 2024 | $8,922 | $164,700 | $62,700 | $102,000 |
| 2023 | $8,922 | $164,700 | $62,700 | $102,000 |
| 2022 | $8,718 | $164,700 | $62,700 | $102,000 |
| 2021 | $5,755 | $164,700 | $62,700 | $102,000 |
| 2020 | $8,461 | $164,700 | $62,700 | $102,000 |
| 2019 | $8,317 | $164,700 | $62,700 | $102,000 |
| 2018 | $8,225 | $164,700 | $62,700 | $102,000 |
| 2017 | $7,958 | $164,700 | $62,700 | $102,000 |
| 2016 | $7,794 | $164,700 | $62,700 | $102,000 |
| 2015 | $7,659 | $164,700 | $62,700 | $102,000 |
| 2014 | $7,581 | $164,700 | $62,700 | $102,000 |
Source: Public Records
Map
Nearby Homes
Your Personal Tour Guide
Ask me questions while you tour the home.