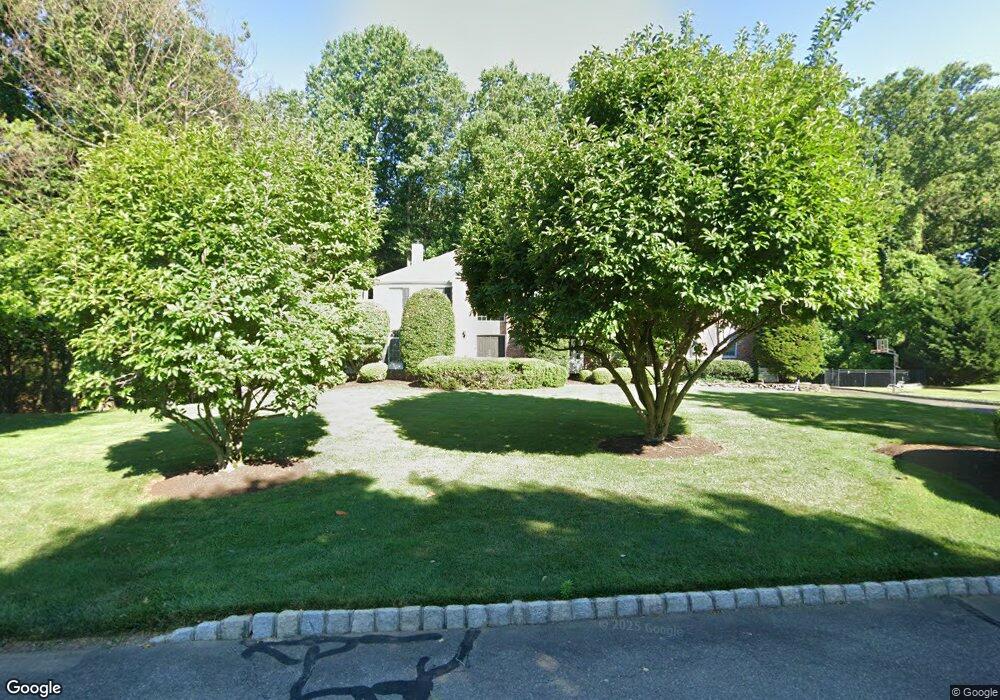
3 Tranquility Ct Holmdel, NJ 07733
Estimated Value: $1,406,000 - $1,631,000
5
Beds
2
Baths
3,890
Sq Ft
$390/Sq Ft
Est. Value
About This Home
This home is located at 3 Tranquility Ct, Holmdel, NJ 07733 and is currently estimated at $1,517,075, approximately $389 per square foot. 3 Tranquility Ct is a home located in Monmouth County with nearby schools including Village School, Indian Hill Elementary School, and William Satz Intermediate School.
Ownership History
Date
Name
Owned For
Owner Type
Purchase Details
Closed on
Mar 10, 2020
Sold by
Lakritz Phillip and Lakritz Diane
Bought by
Lakritz Diane
Current Estimated Value
Home Financials for this Owner
Home Financials are based on the most recent Mortgage that was taken out on this home.
Original Mortgage
$658,500
Outstanding Balance
$582,084
Interest Rate
3.4%
Mortgage Type
New Conventional
Estimated Equity
$934,991
Purchase Details
Closed on
Oct 1, 1997
Sold by
Valley Holmdel
Bought by
Lakritz Philip and Lakritz Diane
Home Financials for this Owner
Home Financials are based on the most recent Mortgage that was taken out on this home.
Original Mortgage
$420,000
Interest Rate
7.46%
Create a Home Valuation Report for This Property
The Home Valuation Report is an in-depth analysis detailing your home's value as well as a comparison with similar homes in the area
Home Values in the Area
Average Home Value in this Area
Purchase History
| Date | Buyer | Sale Price | Title Company |
|---|---|---|---|
| Lakritz Diane | -- | Break Water Title Agency Llc | |
| Lakritz Philip | $525,000 | -- |
Source: Public Records
Mortgage History
| Date | Status | Borrower | Loan Amount |
|---|---|---|---|
| Open | Lakritz Diane | $658,500 | |
| Closed | Lakritz Philip | $420,000 |
Source: Public Records
Tax History
| Year | Tax Paid | Tax Assessment Tax Assessment Total Assessment is a certain percentage of the fair market value that is determined by local assessors to be the total taxable value of land and additions on the property. | Land | Improvement |
|---|---|---|---|---|
| 2025 | $21,066 | $1,388,100 | $628,900 | $759,200 |
| 2024 | $20,243 | $1,336,700 | $646,500 | $690,200 |
Source: Public Records
Map
Nearby Homes
- 118 State Route 34
- 7 Canyon Woods Ct
- 1 Davey Place
- 3 Tolas Dr
- 8 Tiberon Dr
- 14 Schanck Rd
- 57 Reids Hill Rd
- 103 Reids Hill Rd
- 1 Flora Dr
- 798 Holmdel Rd
- 615 Randall Way
- 323 Arlene Terrace
- 6 Flora Dr
- 7 Flora Dr
- 72 Idlebrook Ln
- 99 Idlebrook Ln
- 315 Wellington Place
- 283 Gloucester Ct
- 292 Gloucester Ct
- 293 Gloucester Ct
Your Personal Tour Guide
Ask me questions while you tour the home.