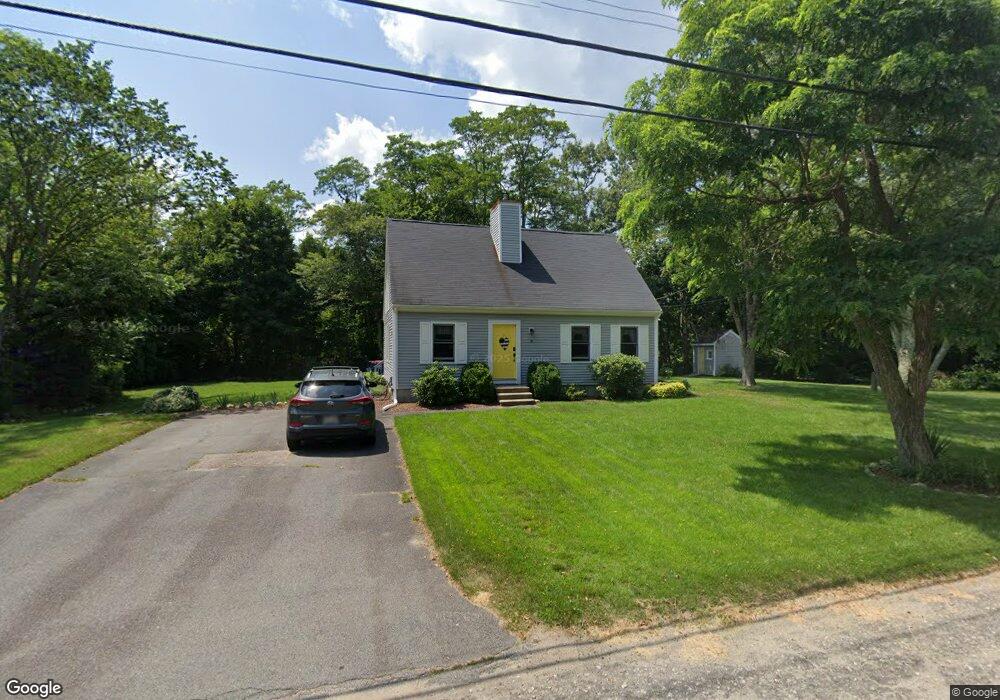
3 Tremont Center Rd West Wareham, MA 02576
Estimated Value: $479,000 - $593,000
3
Beds
2
Baths
1,201
Sq Ft
$427/Sq Ft
Est. Value
About This Home
This home is located at 3 Tremont Center Rd, West Wareham, MA 02576 and is currently estimated at $513,163, approximately $427 per square foot. 3 Tremont Center Rd is a home located in Plymouth County.
Ownership History
Date
Name
Owned For
Owner Type
Purchase Details
Closed on
Aug 6, 2018
Sold by
Petrson William J and Peterson Lynn G
Bought by
Peterson Lynn G
Current Estimated Value
Home Financials for this Owner
Home Financials are based on the most recent Mortgage that was taken out on this home.
Original Mortgage
$210,000
Outstanding Balance
$178,848
Interest Rate
3.75%
Mortgage Type
Adjustable Rate Mortgage/ARM
Estimated Equity
$334,315
Purchase Details
Closed on
Sep 1, 1994
Sold by
Stclair David V
Bought by
Peterson William J and Peterson Lynn G
Create a Home Valuation Report for This Property
The Home Valuation Report is an in-depth analysis detailing your home's value as well as a comparison with similar homes in the area
Home Values in the Area
Average Home Value in this Area
Purchase History
| Date | Buyer | Sale Price | Title Company |
|---|---|---|---|
| Peterson Lynn G | -- | -- | |
| Peterson Lynn G | -- | -- | |
| Peterson William J | $112,000 | -- | |
| Peterson William J | $112,000 | -- |
Source: Public Records
Mortgage History
| Date | Status | Borrower | Loan Amount |
|---|---|---|---|
| Open | Peterson Lynn G | $210,000 | |
| Closed | Peterson Lynn G | $210,000 | |
| Previous Owner | Peterson William J | $135,400 | |
| Previous Owner | Peterson William J | $123,000 | |
| Previous Owner | Peterson William J | $115,000 |
Source: Public Records
Tax History
| Year | Tax Paid | Tax Assessment Tax Assessment Total Assessment is a certain percentage of the fair market value that is determined by local assessors to be the total taxable value of land and additions on the property. | Land | Improvement |
|---|---|---|---|---|
| 2025 | $4,597 | $441,200 | $132,100 | $309,100 |
| 2024 | $4,714 | $419,800 | $105,900 | $313,900 |
| 2023 | $4,244 | $375,000 | $96,500 | $278,500 |
| 2022 | $4,244 | $322,000 | $96,500 | $225,500 |
| 2021 | $4,206 | $312,700 | $96,500 | $216,200 |
| 2020 | $4,022 | $303,300 | $96,500 | $206,800 |
| 2019 | $3,663 | $275,600 | $99,600 | $176,000 |
| 2018 | $3,409 | $250,100 | $99,600 | $150,500 |
| 2017 | $3,278 | $243,700 | $99,600 | $144,100 |
| 2016 | $3,188 | $235,600 | $101,000 | $134,600 |
| 2015 | $3,079 | $235,600 | $101,000 | $134,600 |
| 2014 | $2,873 | $223,600 | $101,000 | $122,600 |
Source: Public Records
Map
Nearby Homes
Your Personal Tour Guide
Ask me questions while you tour the home.