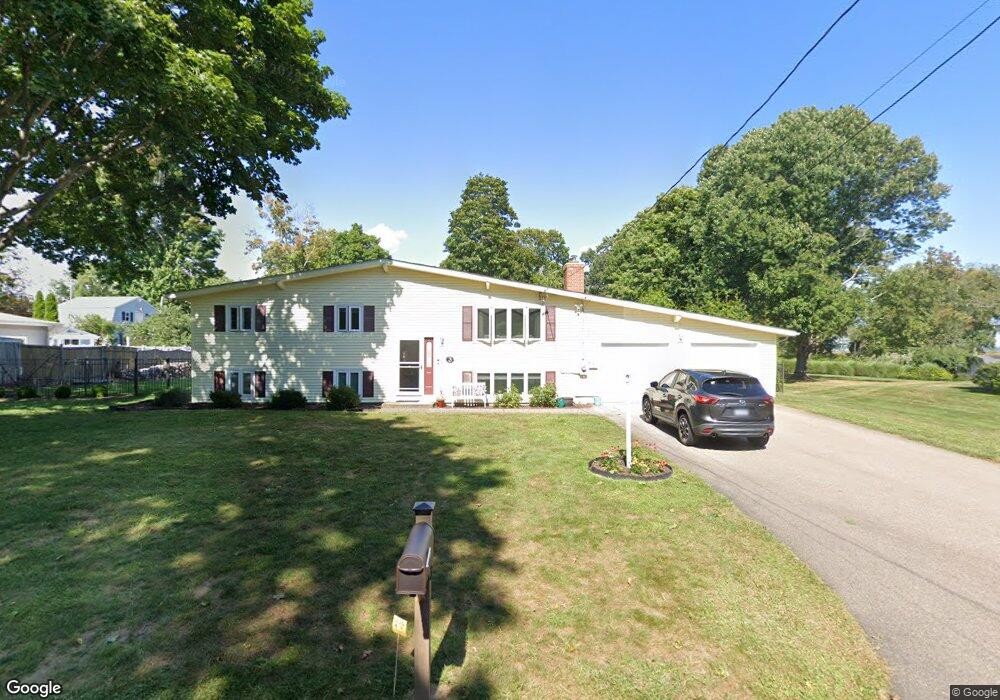
3 Tudor Ct E Old Saybrook, CT 06475
Estimated Value: $496,000 - $698,000
3
Beds
2
Baths
1,056
Sq Ft
$559/Sq Ft
Est. Value
About This Home
This home is located at 3 Tudor Ct E, Old Saybrook, CT 06475 and is currently estimated at $590,323, approximately $559 per square foot. 3 Tudor Ct E is a home located in Middlesex County with nearby schools including Kathleen E. Goodwin School, Old Saybrook Middle School, and Old Saybrook Senior High School.
Ownership History
Date
Name
Owned For
Owner Type
Purchase Details
Closed on
Mar 18, 2009
Sold by
Sutay Bruce and Sutay Kristina
Bought by
Travisano Jonathan and Travisano Andrea
Current Estimated Value
Home Financials for this Owner
Home Financials are based on the most recent Mortgage that was taken out on this home.
Original Mortgage
$234,000
Outstanding Balance
$149,736
Interest Rate
5.25%
Estimated Equity
$440,587
Purchase Details
Closed on
Oct 12, 2004
Sold by
Vasil Charles and Vasil Lynette
Bought by
Sutay J Bruce and Sutay Kristina
Home Financials for this Owner
Home Financials are based on the most recent Mortgage that was taken out on this home.
Original Mortgage
$150,000
Interest Rate
5.84%
Create a Home Valuation Report for This Property
The Home Valuation Report is an in-depth analysis detailing your home's value as well as a comparison with similar homes in the area
Home Values in the Area
Average Home Value in this Area
Purchase History
| Date | Buyer | Sale Price | Title Company |
|---|---|---|---|
| Travisano Jonathan | $285,000 | -- | |
| Sutay J Bruce | $312,000 | -- |
Source: Public Records
Mortgage History
| Date | Status | Borrower | Loan Amount |
|---|---|---|---|
| Open | Sutay J Bruce | $234,000 | |
| Previous Owner | Sutay J Bruce | $150,000 | |
| Previous Owner | Sutay J Bruce | $75,400 | |
| Previous Owner | Sutay J Bruce | $40,000 |
Source: Public Records
Tax History
| Year | Tax Paid | Tax Assessment Tax Assessment Total Assessment is a certain percentage of the fair market value that is determined by local assessors to be the total taxable value of land and additions on the property. | Land | Improvement |
|---|---|---|---|---|
| 2025 | $4,701 | $303,300 | $114,400 | $188,900 |
| 2024 | $4,610 | $303,300 | $114,400 | $188,900 |
| 2023 | $4,172 | $204,000 | $81,500 | $122,500 |
| 2022 | $4,096 | $204,000 | $81,500 | $122,500 |
| 2021 | $4,090 | $204,000 | $81,500 | $122,500 |
| 2020 | $4,062 | $202,600 | $81,500 | $121,100 |
| 2019 | $3,999 | $202,500 | $81,400 | $121,100 |
| 2018 | $3,996 | $203,900 | $81,400 | $122,500 |
| 2017 | $4,009 | $203,900 | $81,400 | $122,500 |
| 2016 | $3,927 | $203,900 | $81,400 | $122,500 |
| 2015 | $3,835 | $203,900 | $81,400 | $122,500 |
| 2014 | $3,772 | $203,900 | $81,400 | $122,500 |
Source: Public Records
Map
Nearby Homes
- 1 Beamon Meadow Place
- 103 Maple Ave
- 104 Knollwood Dr
- 73 Knollwood Dr
- 105 Fenwood Dr
- 41 Briarwood Dr
- 372 Maple Ave
- 446 Main St Unit 9
- 24 W Shore Dr
- 18 Quarry St
- 24 Church St
- 25 Sunset Rd Unit 7
- 10 Mulberry St
- 21 Fenwick St
- 60 Ingham Hill Rd
- 125 Main St
- 122 Old Post Rd
- 1333A Boston Post Rd
- 25 Pond Rd
- 100 Dudley Ave Unit H43
Your Personal Tour Guide
Ask me questions while you tour the home.