3 Tulip Ct Oakhurst, NJ 07755
Estimated Value: $2,778,000 - $4,963,000
4
Beds
3
Baths
3,751
Sq Ft
$966/Sq Ft
Est. Value
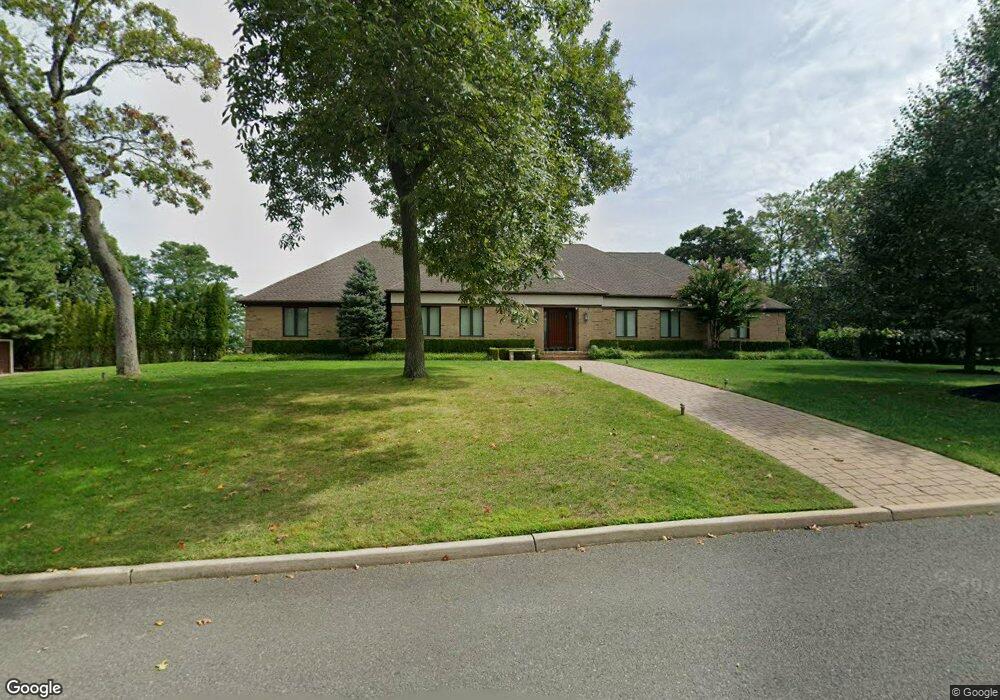
About This Home
This home is located at 3 Tulip Ct, Oakhurst, NJ 07755 and is currently estimated at $3,623,218, approximately $965 per square foot. 3 Tulip Ct is a home located in Monmouth County with nearby schools including Ocean Township High School, Bet Yaakov of the Jersey Shore, and Ma'or Yeshiva High School for Boys.
Ownership History
Date
Name
Owned For
Owner Type
Purchase Details
Closed on
Dec 13, 2012
Sold by
Betesh Sion
Bought by
3 Tulip Court Llc
Current Estimated Value
Purchase Details
Closed on
Sep 13, 2012
Sold by
Betesh Sion and Betesh Lorraine
Bought by
Betesh Sion
Purchase Details
Closed on
Jun 1, 2006
Sold by
Betesh Lorraine
Bought by
Betesh Sion and Betesh Lorraine
Purchase Details
Closed on
Jul 2, 2002
Sold by
Gold Pepa
Bought by
Betesh Sion
Home Financials for this Owner
Home Financials are based on the most recent Mortgage that was taken out on this home.
Original Mortgage
$300,000
Interest Rate
6.79%
Create a Home Valuation Report for This Property
The Home Valuation Report is an in-depth analysis detailing your home's value as well as a comparison with similar homes in the area
Home Values in the Area
Average Home Value in this Area
Purchase History
| Date | Buyer | Sale Price | Title Company |
|---|---|---|---|
| 3 Tulip Court Llc | -- | None Available | |
| Betesh Sion | -- | None Available | |
| Betesh Sion | -- | -- | |
| Betesh Sion | $990,000 | -- |
Source: Public Records
Mortgage History
| Date | Status | Borrower | Loan Amount |
|---|---|---|---|
| Previous Owner | Betesh Sion | $300,000 |
Source: Public Records
Tax History Compared to Growth
Tax History
| Year | Tax Paid | Tax Assessment Tax Assessment Total Assessment is a certain percentage of the fair market value that is determined by local assessors to be the total taxable value of land and additions on the property. | Land | Improvement |
|---|---|---|---|---|
| 2025 | $44,505 | $3,378,400 | $2,350,000 | $1,028,400 |
| 2024 | $39,887 | $3,121,000 | $2,115,000 | $1,006,000 |
| 2023 | $39,887 | $2,608,700 | $1,865,000 | $743,700 |
| 2022 | $39,257 | $2,552,100 | $1,865,000 | $687,100 |
| 2021 | $34,963 | $1,997,800 | $1,410,000 | $587,800 |
| 2020 | $39,225 | $1,970,100 | $1,360,000 | $610,100 |
| 2019 | $34,963 | $1,714,700 | $1,110,000 | $604,700 |
| 2018 | $35,315 | $1,686,500 | $1,110,000 | $576,500 |
| 2017 | $34,872 | $1,658,200 | $1,110,000 | $548,200 |
| 2016 | $28,535 | $1,220,500 | $578,000 | $642,500 |
| 2015 | $27,290 | $1,181,900 | $556,000 | $625,900 |
| 2014 | $26,019 | $1,142,200 | $550,000 | $592,200 |
Source: Public Records
Map
Nearby Homes